Lab 5 Setup
There are several ways one can configure the Dynatrace AWS monitor, but for this workshop we will use a quick solution using AWS Role based access following these basic steps:
- Create AWS IAM policy for monitoring
- Start the creation of a new AWS role for monitoring
- Start the creation of a Dynatrace AWS connection and generate connection token
- Complete AWS policy role setup by adding the Dynatrace token and attaching AWS policy
- Complete the Dynatrace Connection setup by adding the AWS account
Step 1 of 5: Create AWS IAM policy for monitoring
The AWS monitoring policy defines the minimum scope of permissions you need to give to Dynatrace to monitor the services running in your AWS account. Create it once and use anytime when enabling Dynatrace access to your AWS account.
1 . Go to Identity and Access Management (IAM) in your Amazon Console.
2 . Go to Policies and click the Create policy button.

3 . Select the JSON tab, and paste this predefined policy from the box below.

{
	"Version": "2012-10-17",
	"Statement": [
		{
			"Sid": "VisualEditor0",
			"Effect": "Allow",
			"Action": [
				"acm-pca:ListCertificateAuthorities",
				"apigateway:GET",
				"apprunner:ListServices",
				"appstream:DescribeFleets",
				"appsync:ListGraphqlApis",
				"athena:ListWorkGroups",
				"autoscaling:DescribeAutoScalingGroups",
				"cloudformation:ListStackResources",
				"cloudfront:ListDistributions",
				"cloudhsm:DescribeClusters",
				"cloudsearch:DescribeDomains",
				"cloudwatch:GetMetricData",
				"cloudwatch:GetMetricStatistics",
				"cloudwatch:ListMetrics",
				"codebuild:ListProjects",
				"datasync:ListTasks",
				"dax:DescribeClusters",
				"directconnect:DescribeConnections",
				"dms:DescribeReplicationInstances",
				"dynamodb:ListTables",
				"dynamodb:ListTagsOfResource",
				"ec2:DescribeAvailabilityZones",
				"ec2:DescribeInstances",
				"ec2:DescribeNatGateways",
				"ec2:DescribeSpotFleetRequests",
				"ec2:DescribeTransitGateways",
				"ec2:DescribeVolumes",
				"ec2:DescribeVpnConnections",
				"ecs:ListClusters",
				"eks:ListClusters",
				"elasticache:DescribeCacheClusters",
				"elasticbeanstalk:DescribeEnvironmentResources",
				"elasticbeanstalk:DescribeEnvironments",
				"elasticfilesystem:DescribeFileSystems",
				"elasticloadbalancing:DescribeInstanceHealth",
				"elasticloadbalancing:DescribeListeners",
				"elasticloadbalancing:DescribeLoadBalancers",
				"elasticloadbalancing:DescribeRules",
				"elasticloadbalancing:DescribeTags",
				"elasticloadbalancing:DescribeTargetHealth",
				"elasticmapreduce:ListClusters",
				"elastictranscoder:ListPipelines",
				"es:ListDomainNames",
				"events:ListEventBuses",
				"firehose:ListDeliveryStreams",
				"fsx:DescribeFileSystems",
				"gamelift:ListFleets",
				"glue:GetJobs",
				"inspector:ListAssessmentTemplates",
				"kafka:ListClusters",
				"kinesis:ListStreams",
				"kinesisanalytics:ListApplications",
				"kinesisvideo:ListStreams",
				"lambda:ListFunctions",
				"lambda:ListTags",
				"lex:GetBots",
				"logs:DescribeLogGroups",
				"mediaconnect:ListFlows",
				"mediaconvert:DescribeEndpoints",
				"mediapackage-vod:ListPackagingConfigurations",
				"mediapackage:ListChannels",
				"mediatailor:ListPlaybackConfigurations",
				"opsworks:DescribeStacks",
				"qldb:ListLedgers",
				"rds:DescribeDBClusters",
				"rds:DescribeDBInstances",
				"rds:DescribeEvents",
				"rds:ListTagsForResource",
				"redshift:DescribeClusters",
				"robomaker:ListSimulationJobs",
				"route53:ListHostedZones",
				"route53resolver:ListResolverEndpoints",
				"s3:ListAllMyBuckets",
				"sagemaker:ListEndpoints",
				"sns:ListTopics",
				"sqs:ListQueues",
				"storagegateway:ListGateways",
				"sts:GetCallerIdentity",
				"swf:ListDomains",
				"tag:GetResources",
				"tag:GetTagKeys",
				"transfer:ListServers",
				"workmail:ListOrganizations",
				"workspaces:DescribeWorkspaces"
			],
			"Resource": "*"
		}
	]
}
4 . You can skip over the Add tags page
5 . One the Review policy page, use the policy name of dynatrace_monitoring_policy
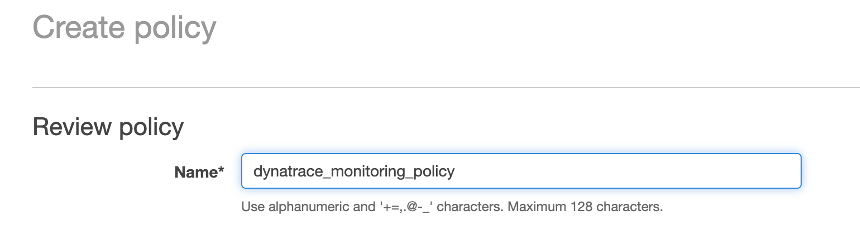
6 . Click Create policy button.
Step 2 of 5: Start the creation of a new AWS role for monitoring
To give Dynatrace SaaS the role-based monitoring access to your AWS account, you need to create a dedicated monitoring role for Dynatrace in your AWS account. Dynatrace will use this role to authenticate in your AWS environment with the scope of permissions as defined by the monitoring policy.
1 . Go to Identity and Access Management (IAM) in your Amazon Console.
2 . Go to Roles and click the create role button.

3 . Select the Another AWS account tile as to establish trust with the Dynatrace account.
4 . Paste 509560245411 into the Account ID field
5 . Select the Require external ID checkbox
6 . Keep this page open and move to next section

💥 TECHNICAL NOTE
The AWS Account ID for Dynatrace SaaS (e.g. https://YOUR_TENANT.live.dynatrace.com/) is 509560245411. This AWS Account ID is the account that the role within the AWS account you are using for the workshop will use. If you were using your own Dynatrace managed cluster, this AWS Account ID value would be different.
Step 3 of 5: Start the creation of a Dynatrace AWS connection and generate connection token
In you don’t have it already, open another browser tab and sign in to Dynatrace
1 . Once logged in, go to Settings -> Cloud and virtualization -> AWS
2 . Click Connect new instance button
3 . Enter the name for this connection as dynatrace-modernize-workshop
4 . Select Role based authentication method.
5 . click the Generate token button

6 . Leave IAM role and AWS Account blank for now and click the Copy button next to the generated token.

Keep this browser window open. We will come back to it shortly to copy the Token and test the connection.
💥 TECHNICAL NOTE
The Token generated on the Dynatrace AWS connection page is used in the external ID field for the AWS role to add another level of security so that the AWS role can only access the data for your specific Dynatrace tenant and Dynatrace connection.
Step 4 of 5: Complete AWS policy role setup by adding the Dynatrace token and attaching AWS policy
Now back in the AWS console tab Create Role page you already have open, enter these values:
Paste the Token value that you just copied from your Dynatrace AWS connection page to the External ID field
Your page should look like this:

7 . Now click the Next: Permissions button on the bottom
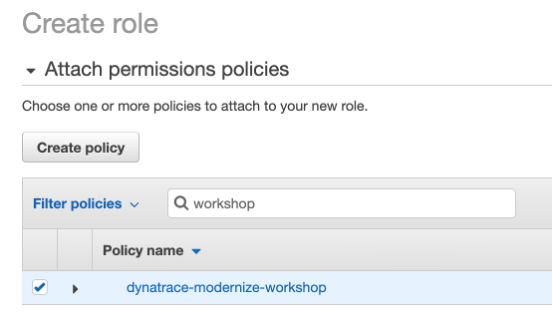
8 . On the Attach permissions policies page, choose the monitoring policy you created earlier. Search for: dynatrace_monitoring_policy. Choose then checkbox next to it and then click the Next: Review button.
9 . Now click the Next: Tags button on the bottom
10 . On the Add Tags page, leave the defaults and click the Next: Review button on the bottom
11 . On the Review page, provide the role name of: dynatrace_monitoring_role.
The role name, trusted entities and policy should have values as shown here.
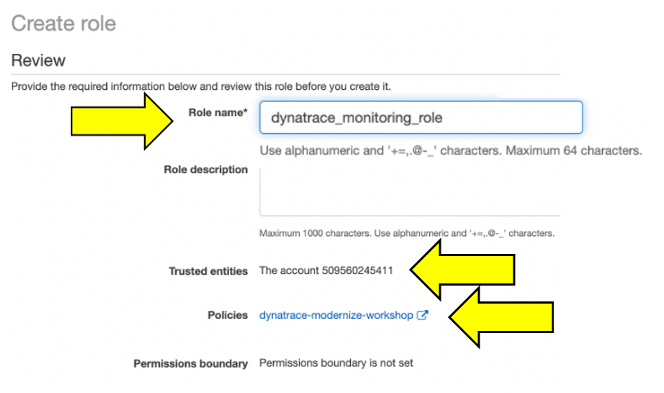
9 . Click the Create Role button.
Step 5 of 5: Complete the Dynatrace Connection setup by adding the AWS account
Now that we have the AWS role, it’s time to connect Dynatrace to your Amazon AWS account using that role.
1 . Go back on the Dynatrace connection page you still have open
2 . In the Role field, use the name of the role you created easier: dynatrace_monitoring_role
4 . The Account ID is the AWS account you want us to pull metrics from. To get your Account ID, go to your AWS Cloudshell and type in this command and copy the Account value from the JSON output as shown here.
aws sts get-caller-identityThe output will look like and the Account = 999111222333
{
    "UserId": "AKDA4GOORJDPOW3CNKDSKD7:tom.jones@mycompany.com",
    "Account": "999111222333",
    "Arn": "arn:aws:sts::838488672964:assumed-role/dtRoleAccountAdmin/tom.jones@mycompany.com"
}
4 . Your Connection page should now look like this:

5 . Click the Connect button to verify and once verified, click the Save button.
If successful, your should see the configuration now on the AWS connections page:
