AWS Dashboard
In addition to monitoring your AWS workloads using OneAgent, Dynatrace provides integration with AWS CloudWatch which adds infrastructure monitoring to gain insight even into serverless application scenarios.
👍 How this helps
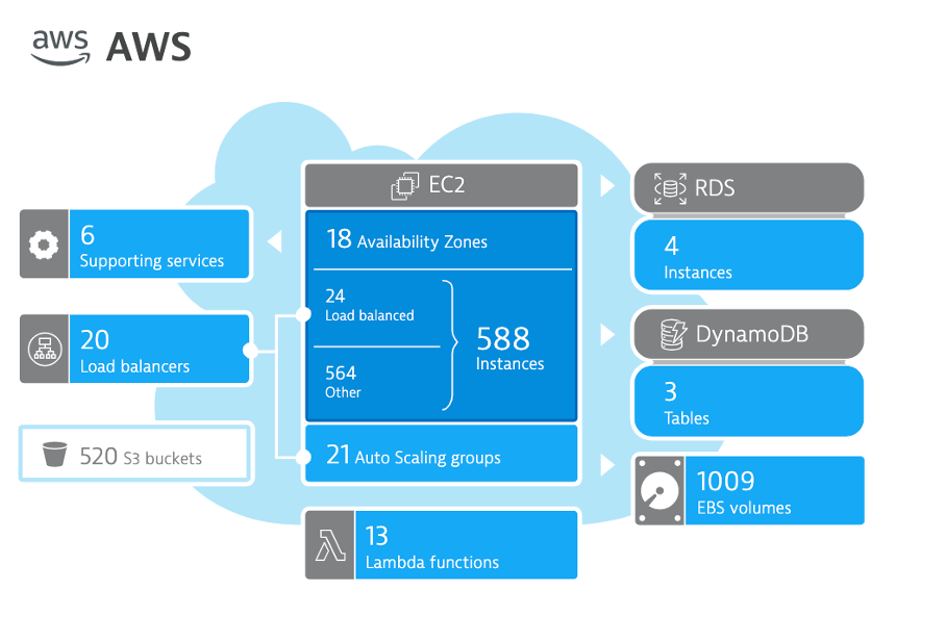
Dynatrace brings value by enriching the data from AWS CloudWatch extending observability into the platform with additional metrics for cloud infrastructure, load balancers, API Management Services, and more.
These metrics are managed by Dynatrace’s AI engine automatically and this extended observability improves operations, reduces MTTR and increases innovation.
Here is an example from another environment.
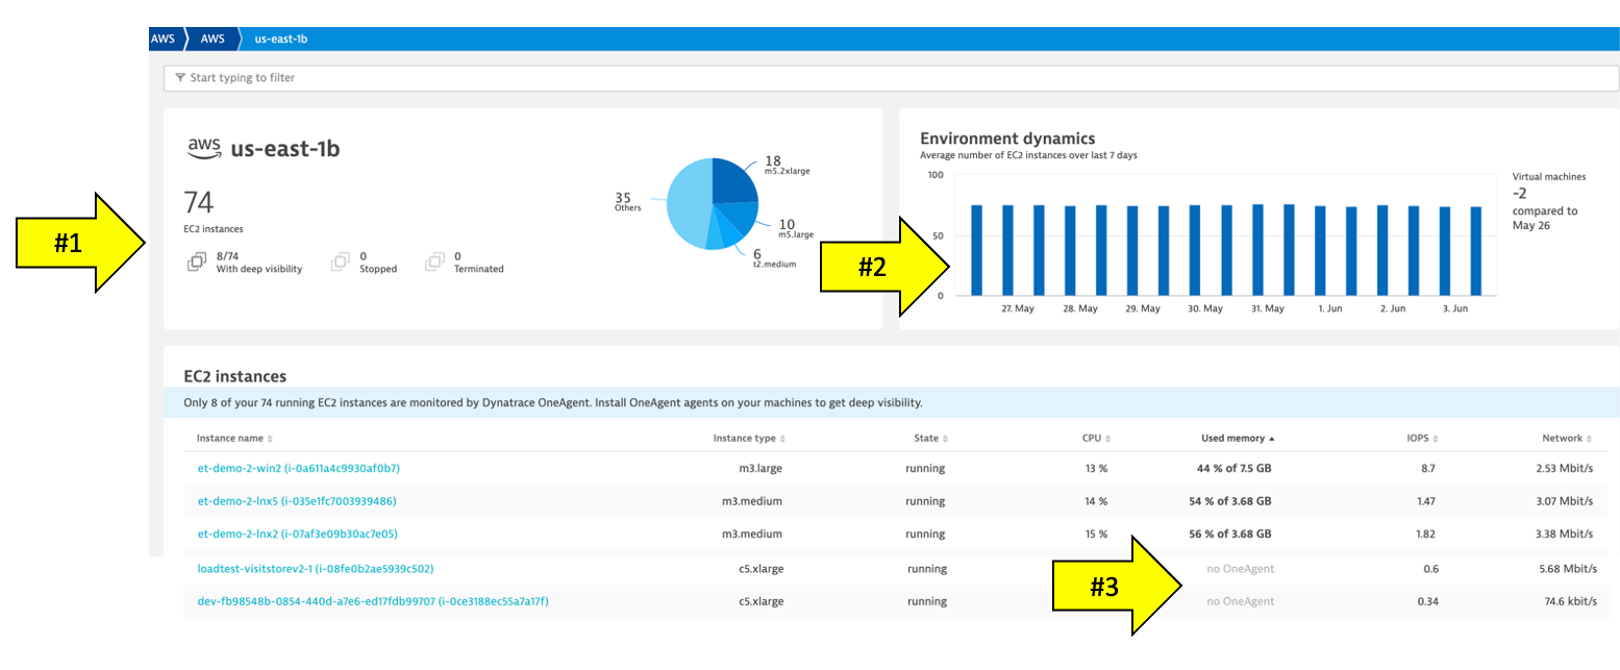
Hosts regional page
Notice the following details: 1. A summary of type and status is shown 1. A running average for virtual machines 1. A table of host with AWS monitor metrics summarized. Notice that both hosts with and without an OneAgent are both shown
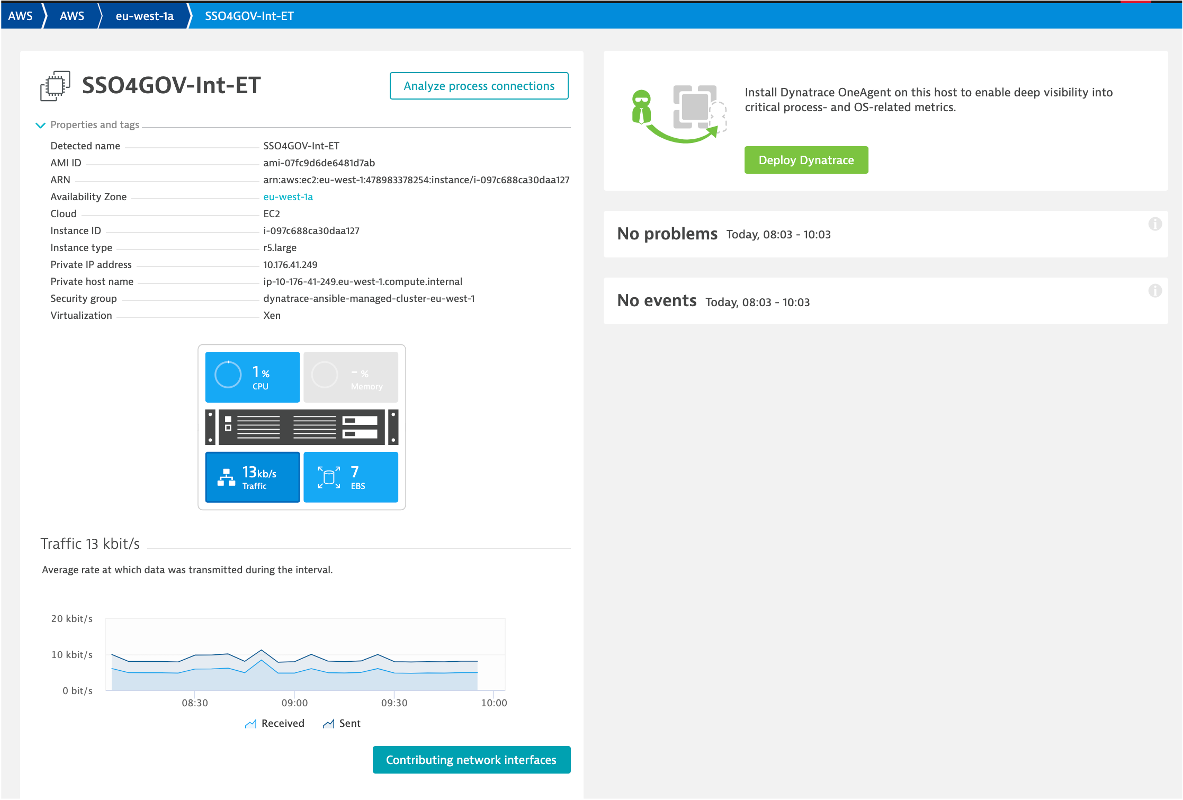
EC2 example
Here is an example of a host with no OneAgent.
Notice the following details: 1. Expand the properties to see more details 1. All the AWS CloudWatch metrics are viewable as time-series data
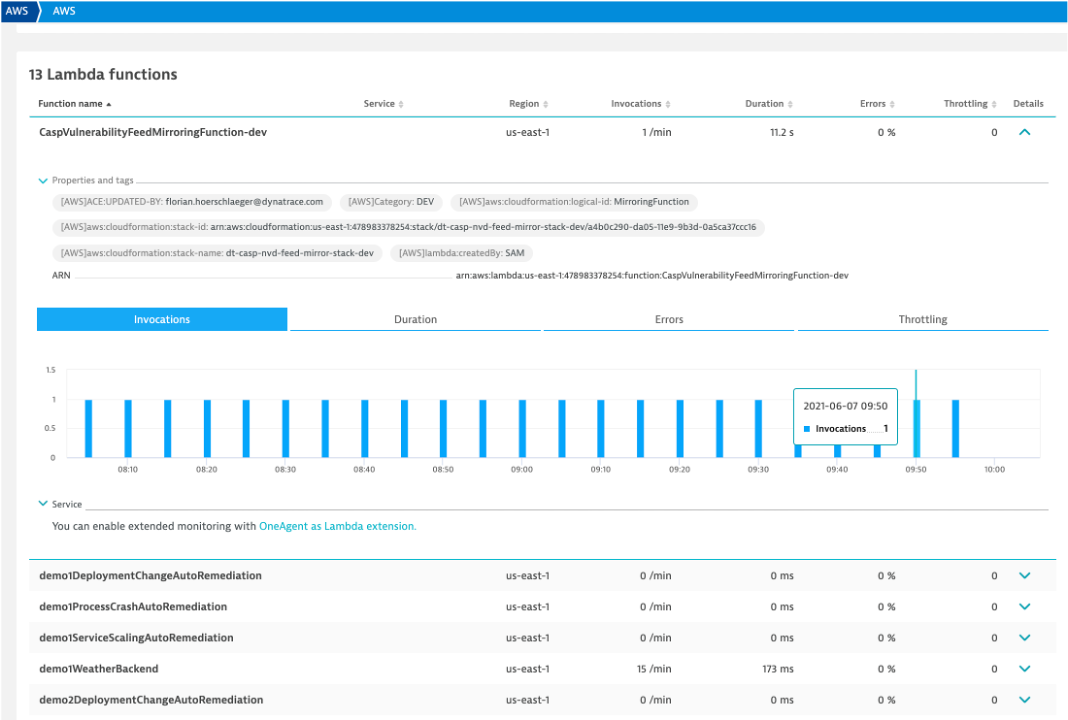
Lambda example
Here is a list of the Lambda functions. Notice tags and time-series data.
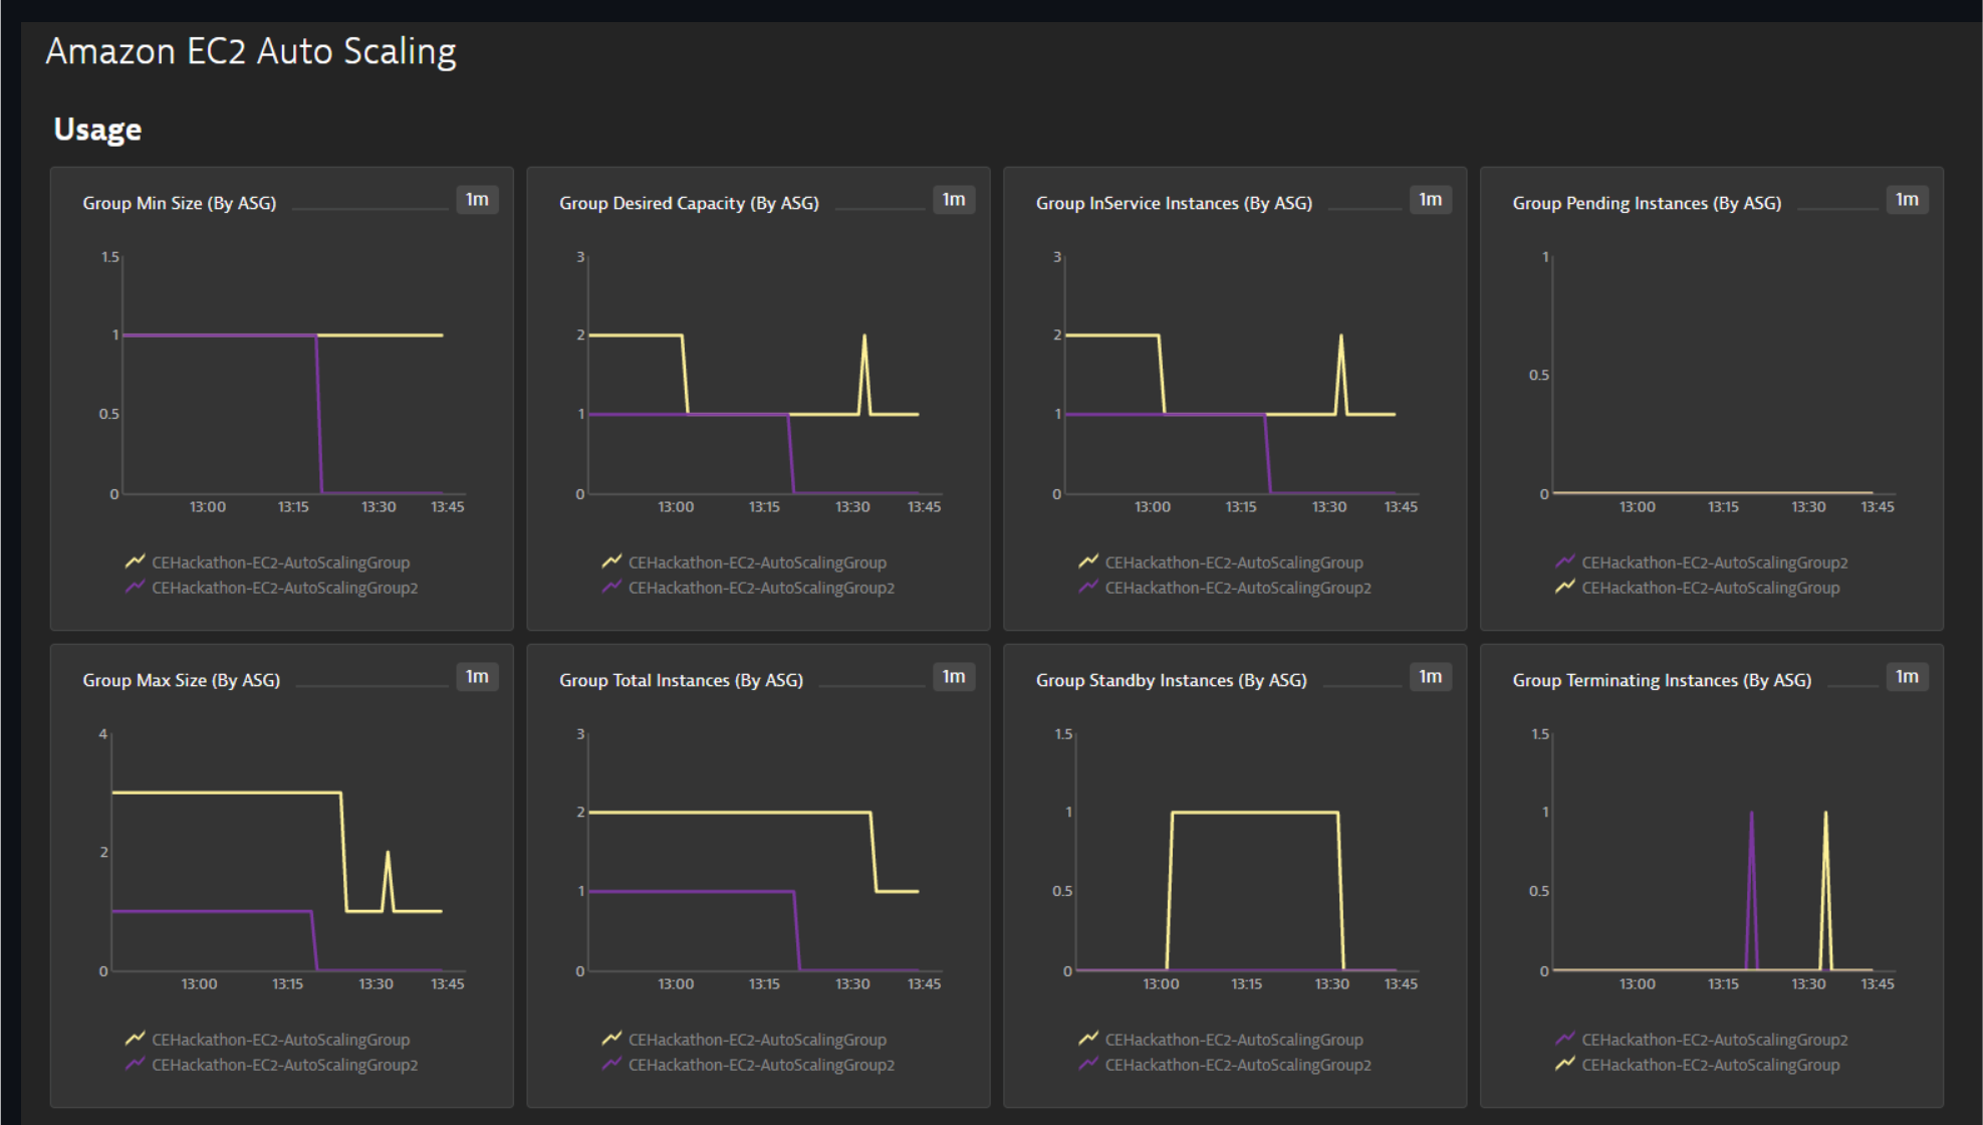
Preset dashboards
As AWS services are enabled, Dynatrace will enable preset dashboards automatically. These can be cloned and customized or hidden as required. Here is one example:
To see more dashboards, navigate to this repository: * https://github.com/Dynatrace/snippets/tree/master/product/dashboarding/aws-supporting-services