Analyze service backtrace
Dynatrace understands your applications transactions from end to end. This transactional insight is visualized several ways like the backtrace.
The backtrace tree view represents the sequence of services that led to this service call, beginning with the page load or user action in the browser.
👍 How this helps
Using the service flow and service backtrace, these two tools give you a complete picture of interdependency to the rest of the environment architecture at host, processes, services, and application perspectives.
Review Service backtrace
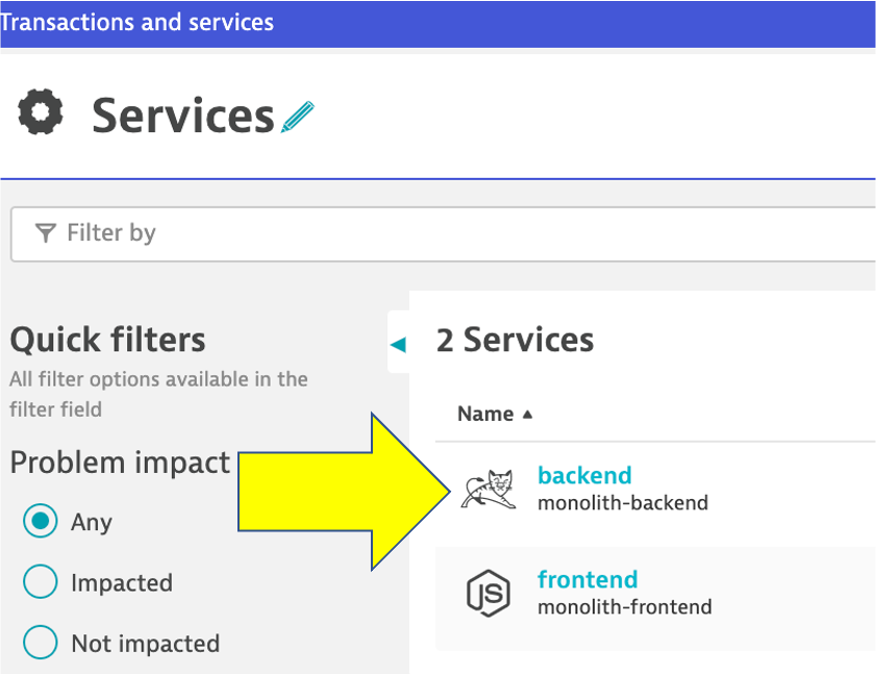
Let’s now take a look at the Services by clicking on the Services left side Dynatrace menu.
Pick the backend service.
On the backend service, click on the Analyze Backtrace button.
![]()
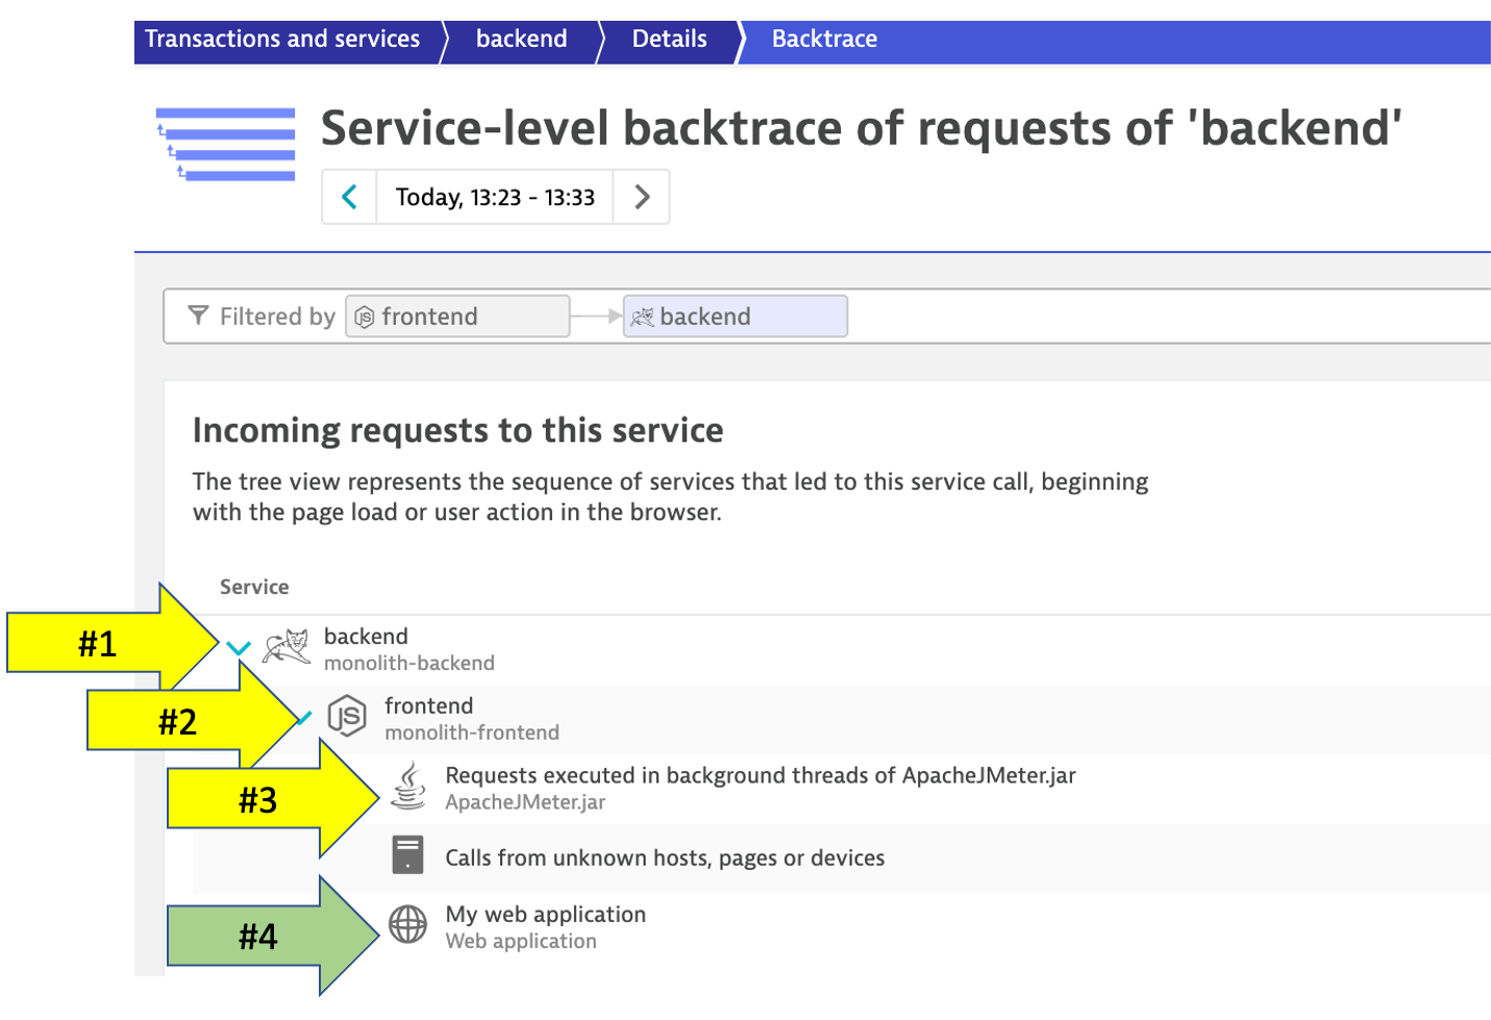
You should be on the service backtrace page where you will see information for this specific service.
This will get more interesting in the next lab, but for the monolith backend, we can see that the backtrace is as follows:
- The starting point is the
backend backendis called by thefrontendserviceApacheJMetertraffic from the load generator script- You may also see browser traffic to the frontend from the
My web application. If you don’t that is OK.
If you click on any of the rows in the backtrace, the bottom portion of the page will expand.