Review Kubernetes within Dynatrace
Now lets verify what happened within Dynatrace.
From the Dynatrace Menu, click
Manage --> Deployment statusto review OneAgent Deployment statusWithin the
Deployment statuspage, next click on theActiveGateoption to review the Active Gate.
Review Kubernetes Architecture
From the left-side menu in Dynatrace choose Kubernetes and navigate to the Kubernetes cluster page as shown below:
NOTE: Be sure that your management zone is NOT filtered!

1 - Kubernetes cluster
A summary the Kubernetes cluster is shown at the top of the Kubernetes dashboard.
2 - Nodes
The resources for the Cluster are summarized for the one-to-many hosts or Cluster nodes in this view.
Explore specific node in the Node Analysis section, pick the analyze nodes button.

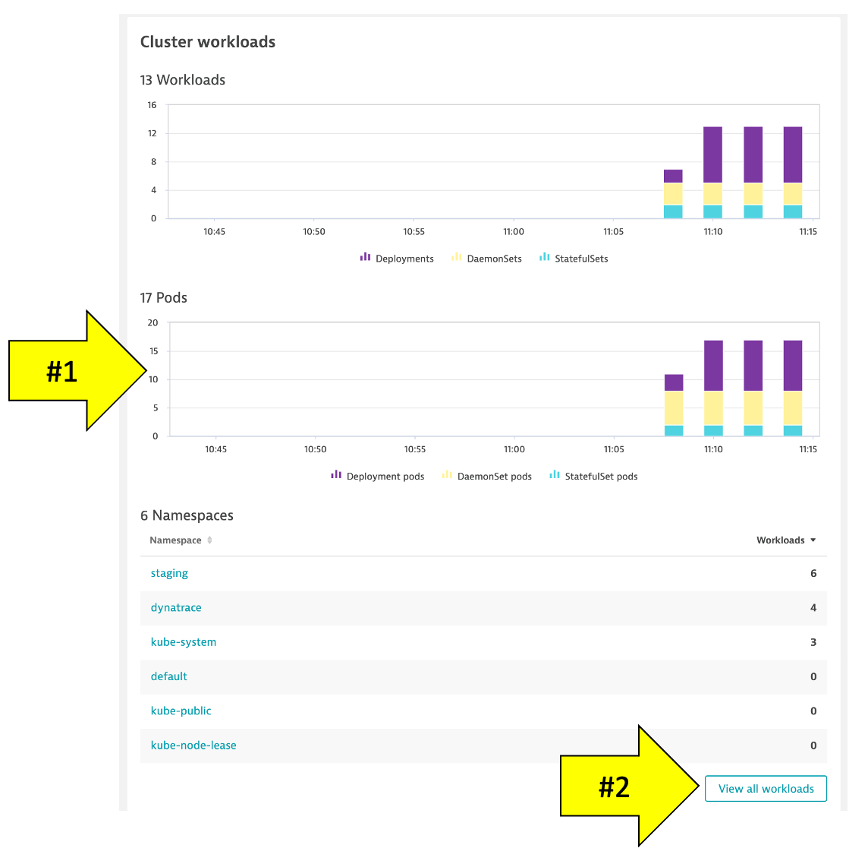
3 - Namespaces
Note: Namespaces are ways to partition your cluster resources to run multiple workloads (for example application A and application B workloads) on same cluster
1. This workload section shows workloads over time
2. In the Cluster workload section, pick the view all workloads button.
In the filter, pick namespace then staging

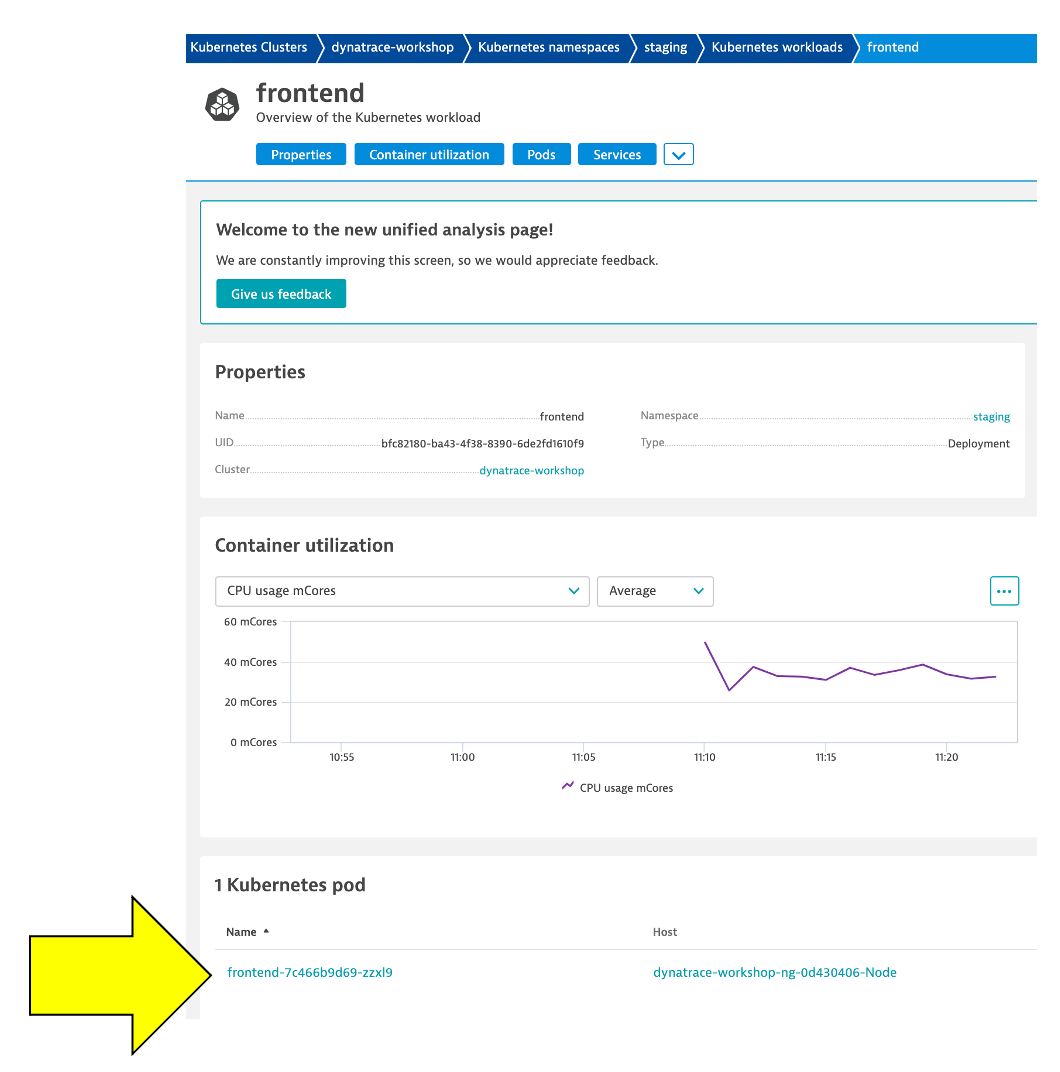
4 - Kubernetes workload
Pick the frontend to drill into.

Review the workload overview page to look at various metrics related to the workload.
Click on Kubernetes POD to look at POD utilization metrics.
5 - POD
Review the POD overview page to look at various metrics related to the POD Click on Container next to look at container metrics

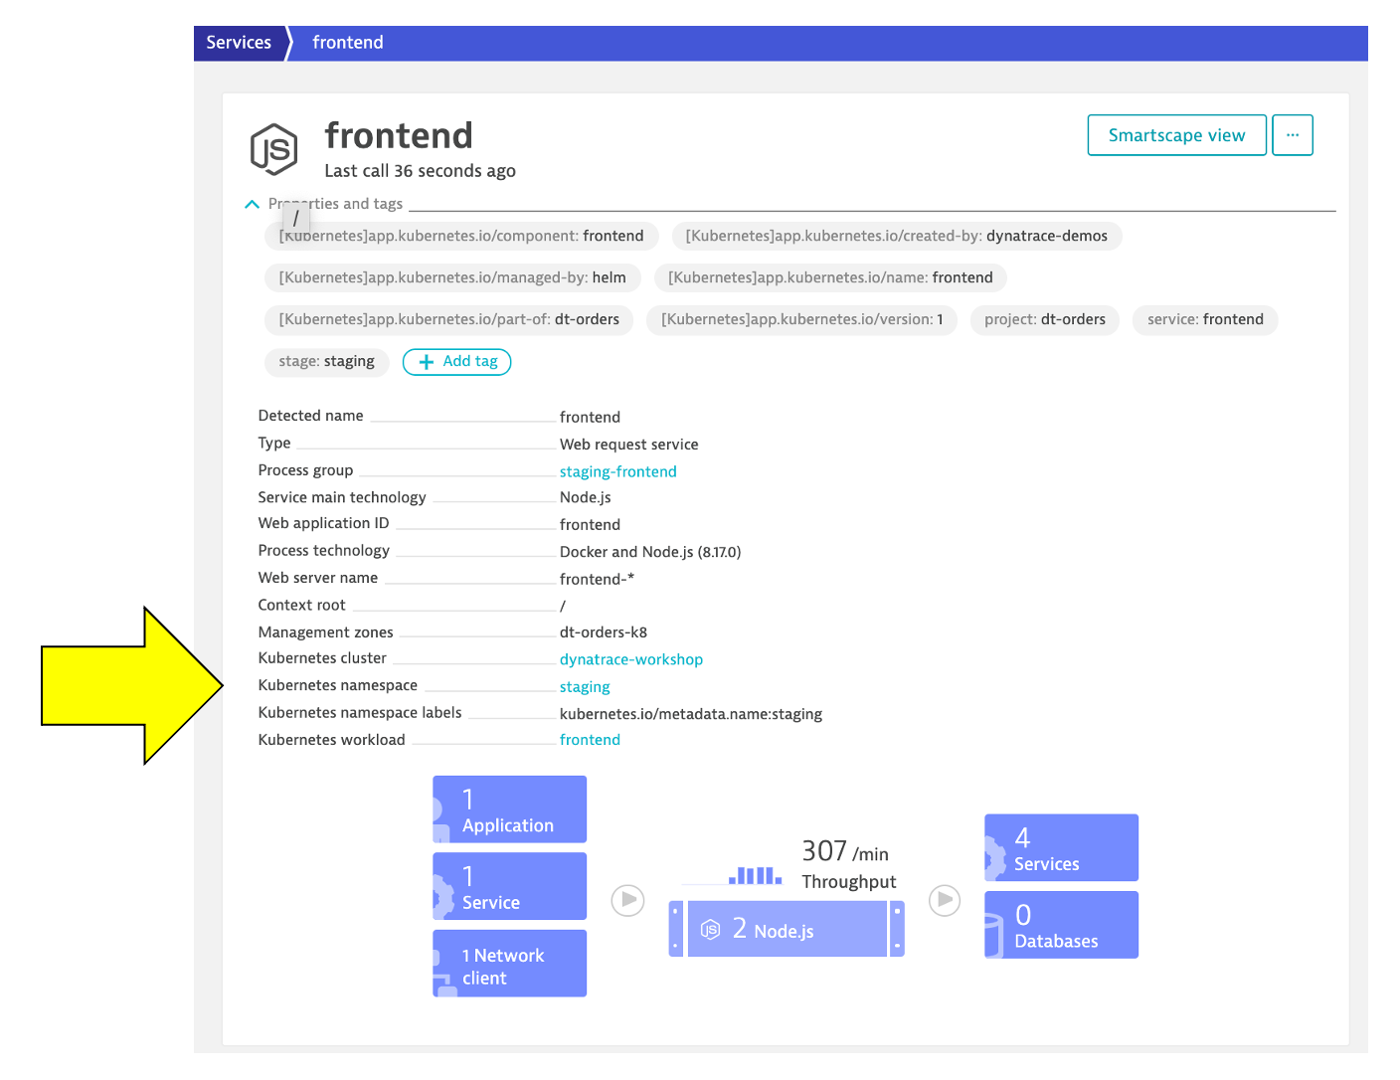
6 - Containers
Referring to the diagram above, expand the properties and tags section to view: 1. Container information 2. Kubernetes information 3. In the info graphic, pick the service to open the services list 4. In the service list, click on k8-frontend service

Next click on 2 Services Icon to review the services running inside the container Select the active front-end service.
7 - Service
This view should now look familiar. In Lab 1, we looked at the service for the frontend and backend. Notice how the Kubernetes information is also available in the service properties.