Backtrace
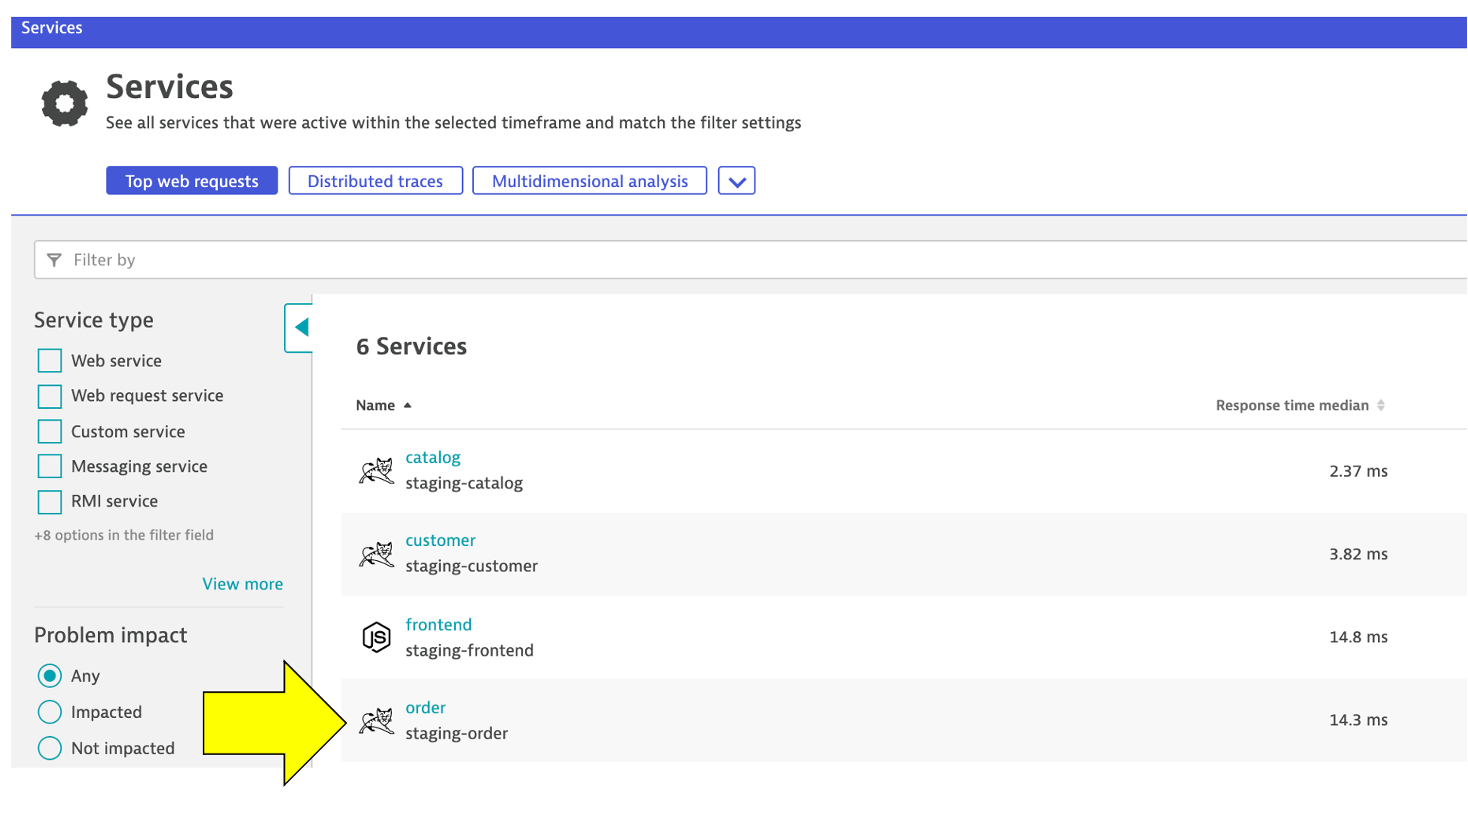
Open Service Page
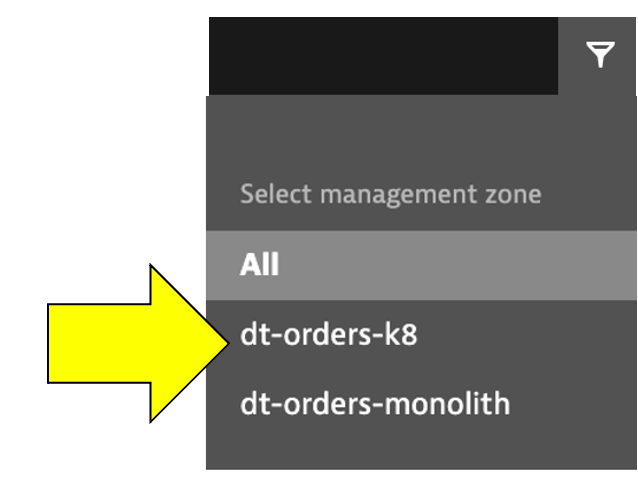
First filter by dt-orders-k8 management zone.
Pick the order service.
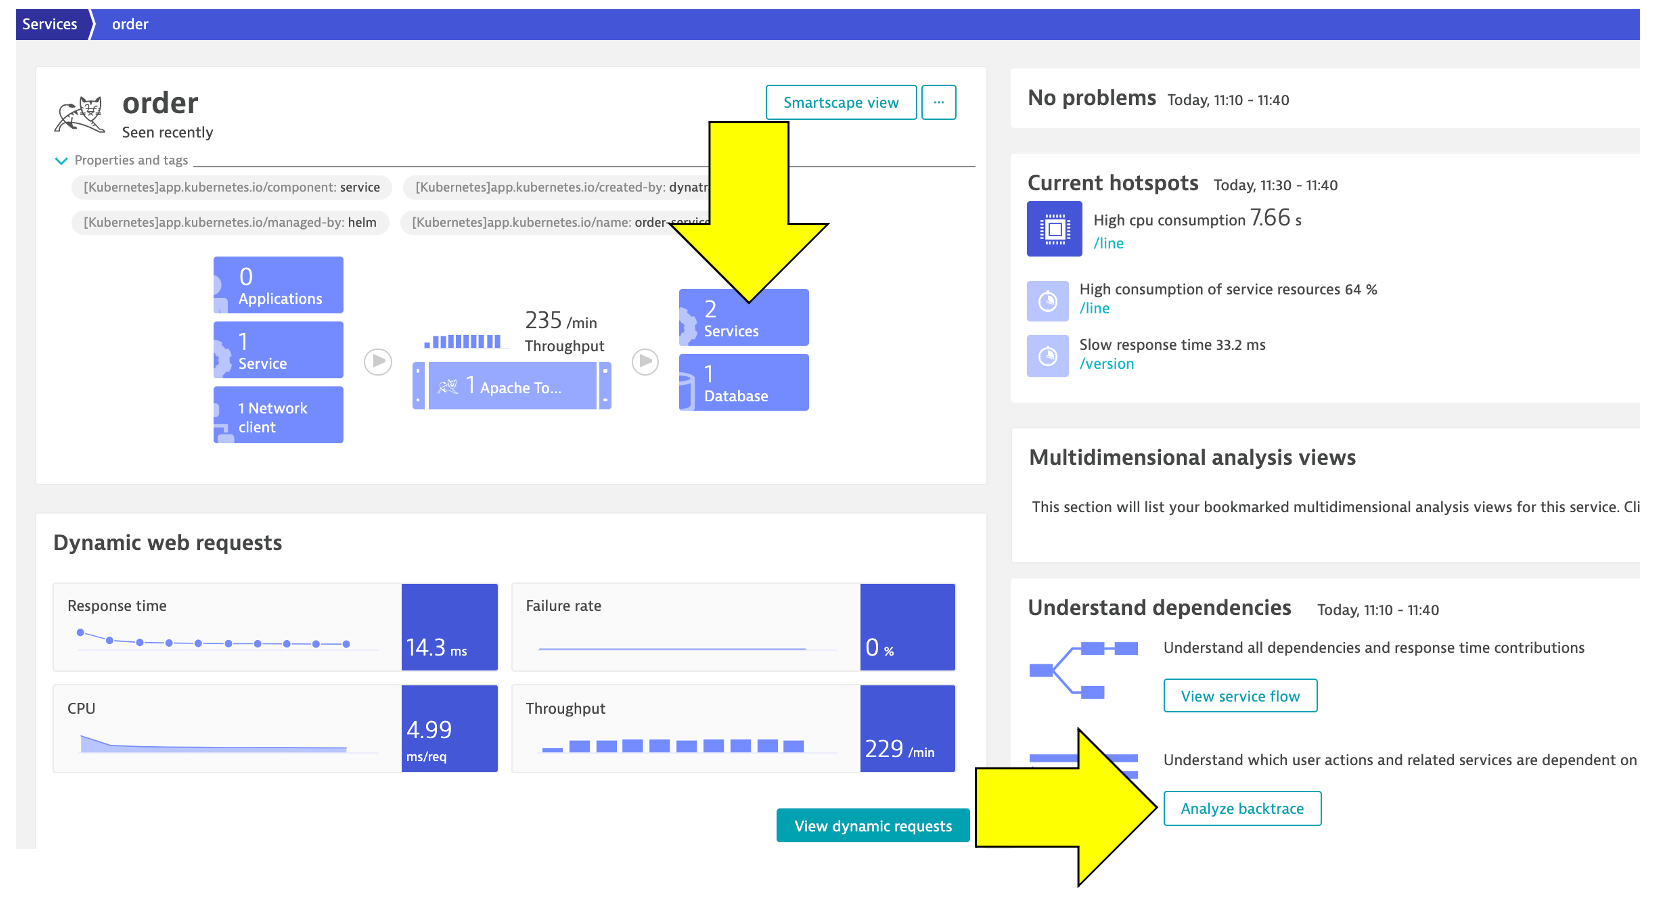
On this service, we can quickly review the inbound and outbound dependencies.
Referring to the picture, within the services infographic, click on the “services” square to get a list of the services that the order service calls.
Open Backtrace Page
To see the backtrace page, just click on the Analyze Backtrace button.
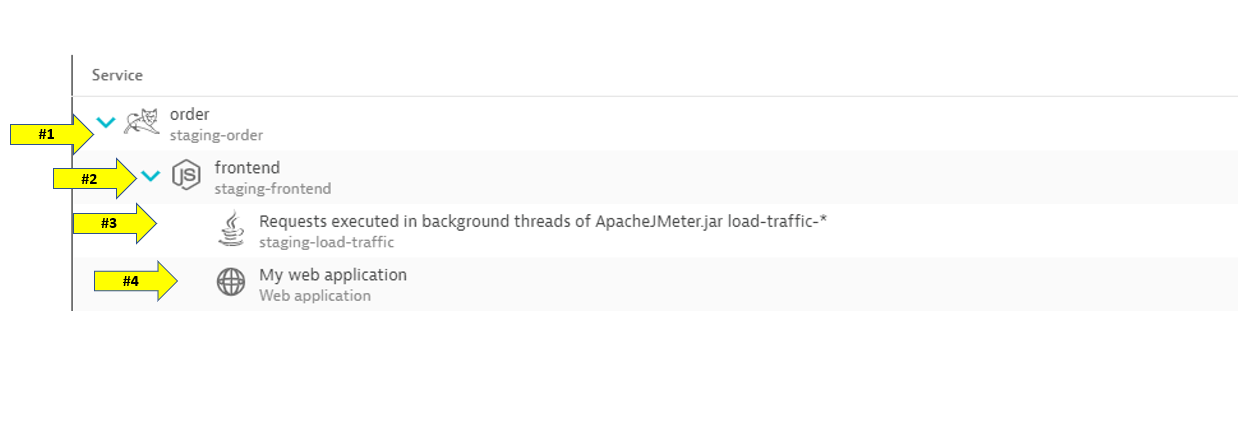
You should be on the service backtrace page where you will see information for this specific service.
This will get more interesting in the next lab, but for the monolith backend, we can see that the backtrace is as follows:
1 . The starting point is the backend
2 . Backend service is called by the front-end
3 . Front-end is a where end user requests start and the user sessions get captured
4 . My web application is the default application that Dynatrace creates
👍 How this helps
The service flow and service backtrace give you a complete picture of interdependency to the rest of the environment architecture at host, processes, services, and application perspectives.