Create Dashboard
From the left side menu in Dynatrace, pick the dashboard menu.
On the dashboard page, click the new dashboard button.

Provide a dashboard name like Cloud Migration Success
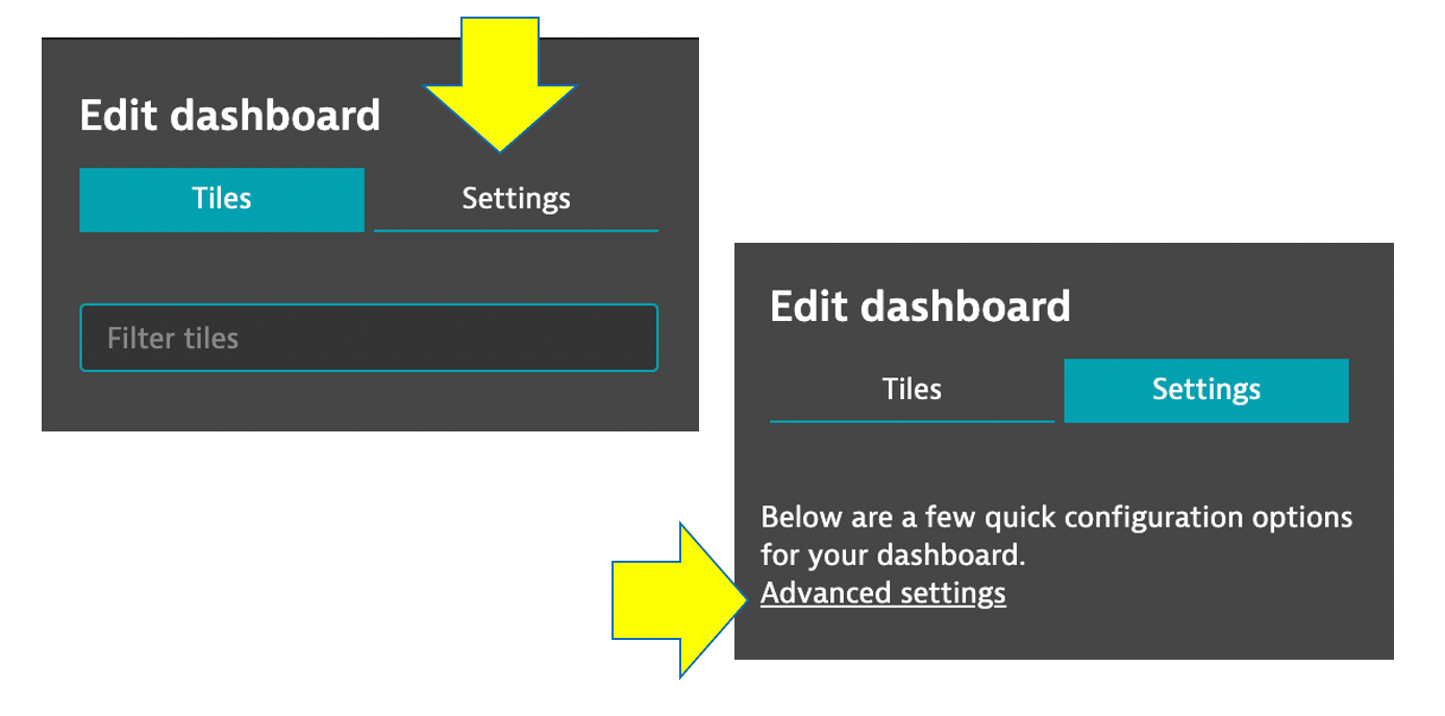
On the blank dashboard page, click the settings. Then click the advanced settings link to open then settings page
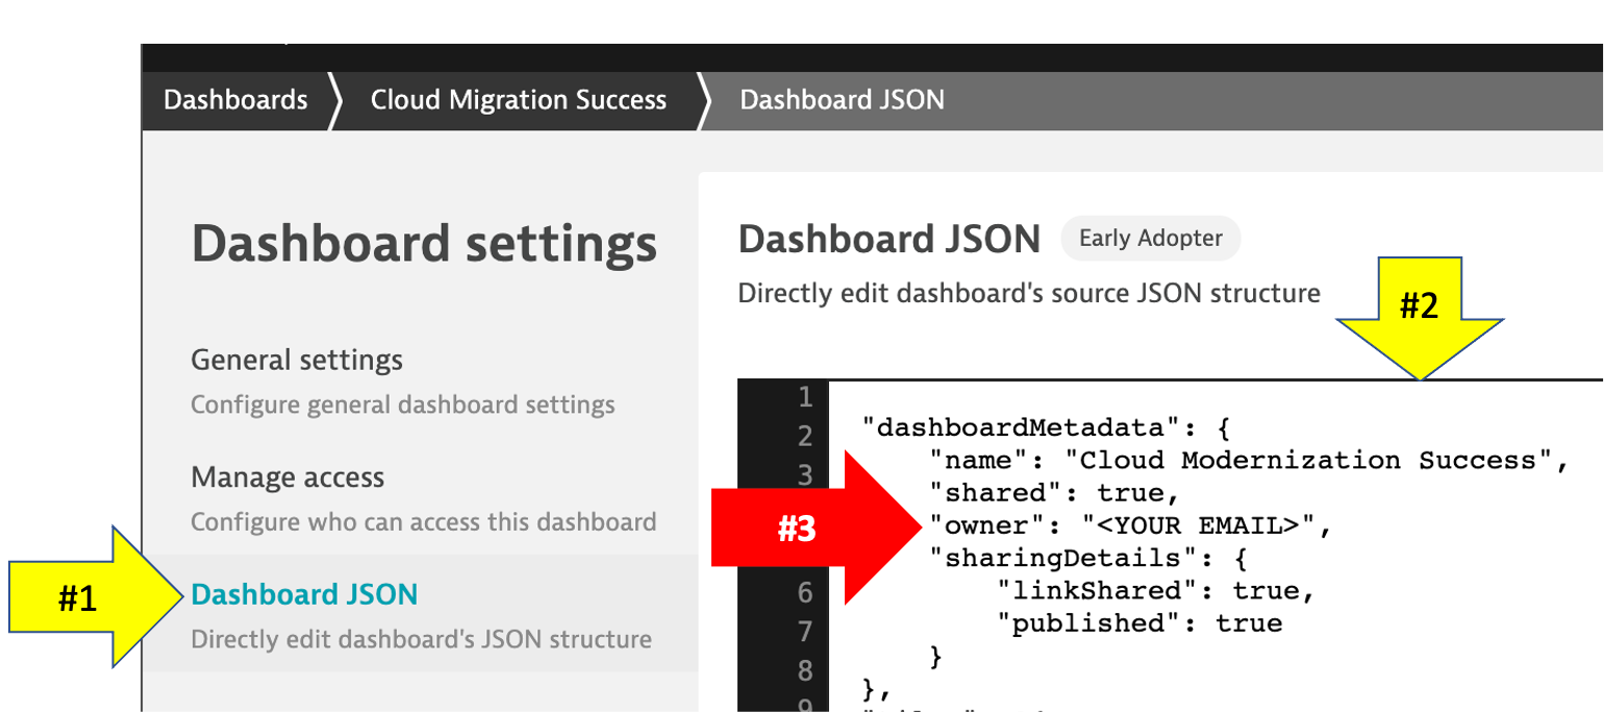
Referring to this picture, follow these steps:
- On the settings page, click the
dashboard JSONmenu. - Copy and paste the following Json content from this file into your dashboard JSON, replacing the existing JSON in the process:
- You MUST replace the
ownerfield to be the email that you logged into Dynatrace with or you will not be able to view it.
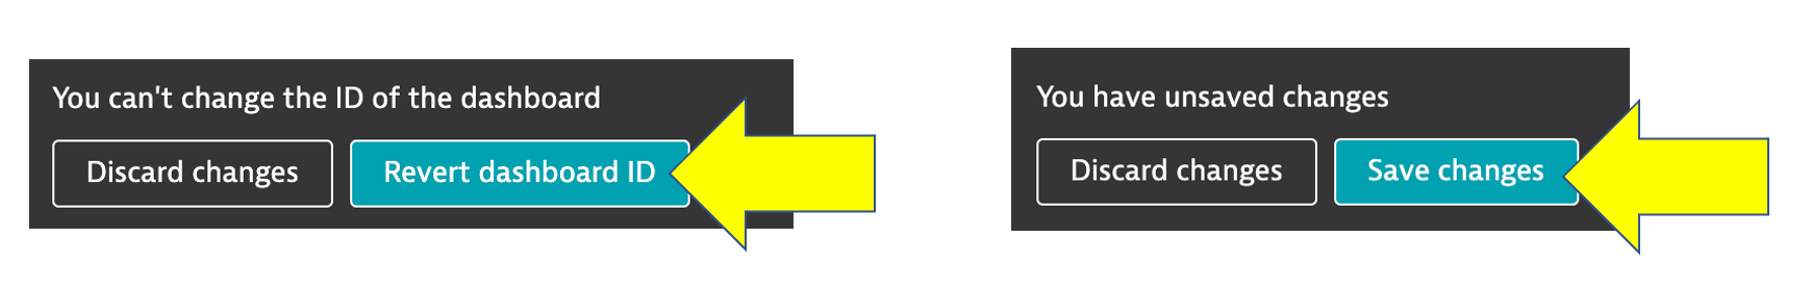
After you edit the email, then click the Revert Dashboard ID button. After you click the Revert Dashboard ID button, click the Save changes button.
View Dashboard
Click the Cloud Migration Success bread crumb menu to go back to the dashboard page
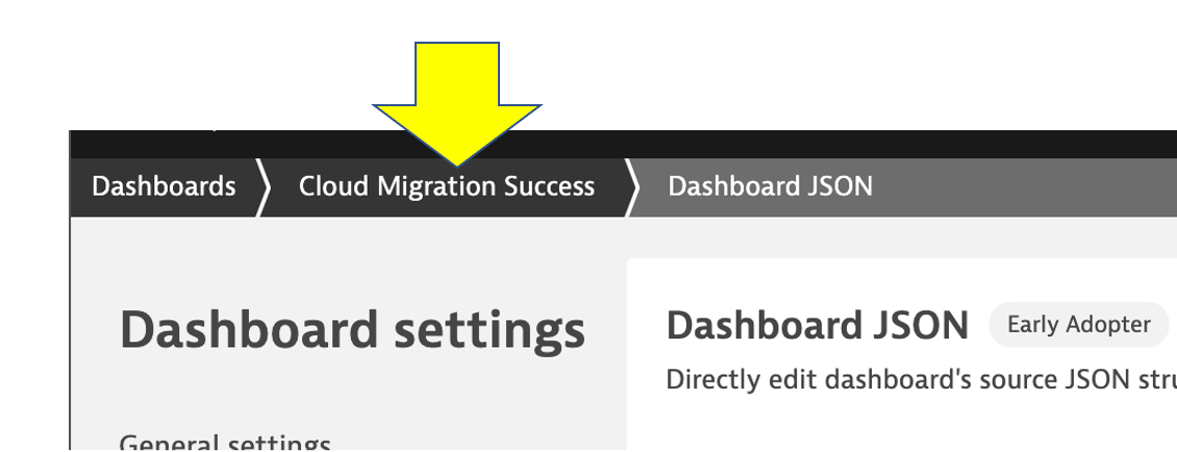
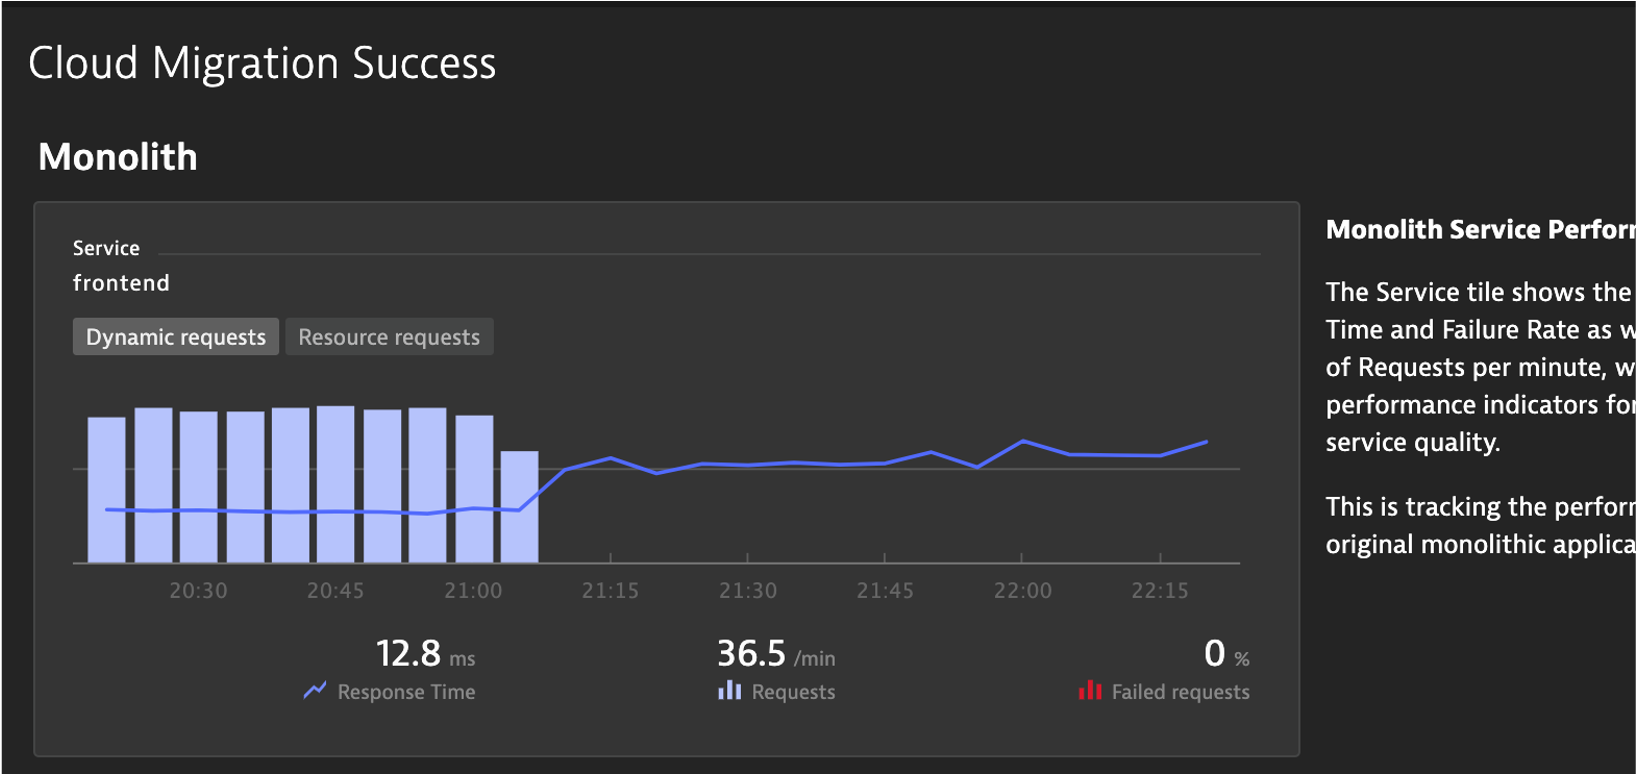
You should now see the dashboard
Edit Dashboard
Now you need to edit the dashboard and adjust the tiles with the SLOs and databases in your environment.
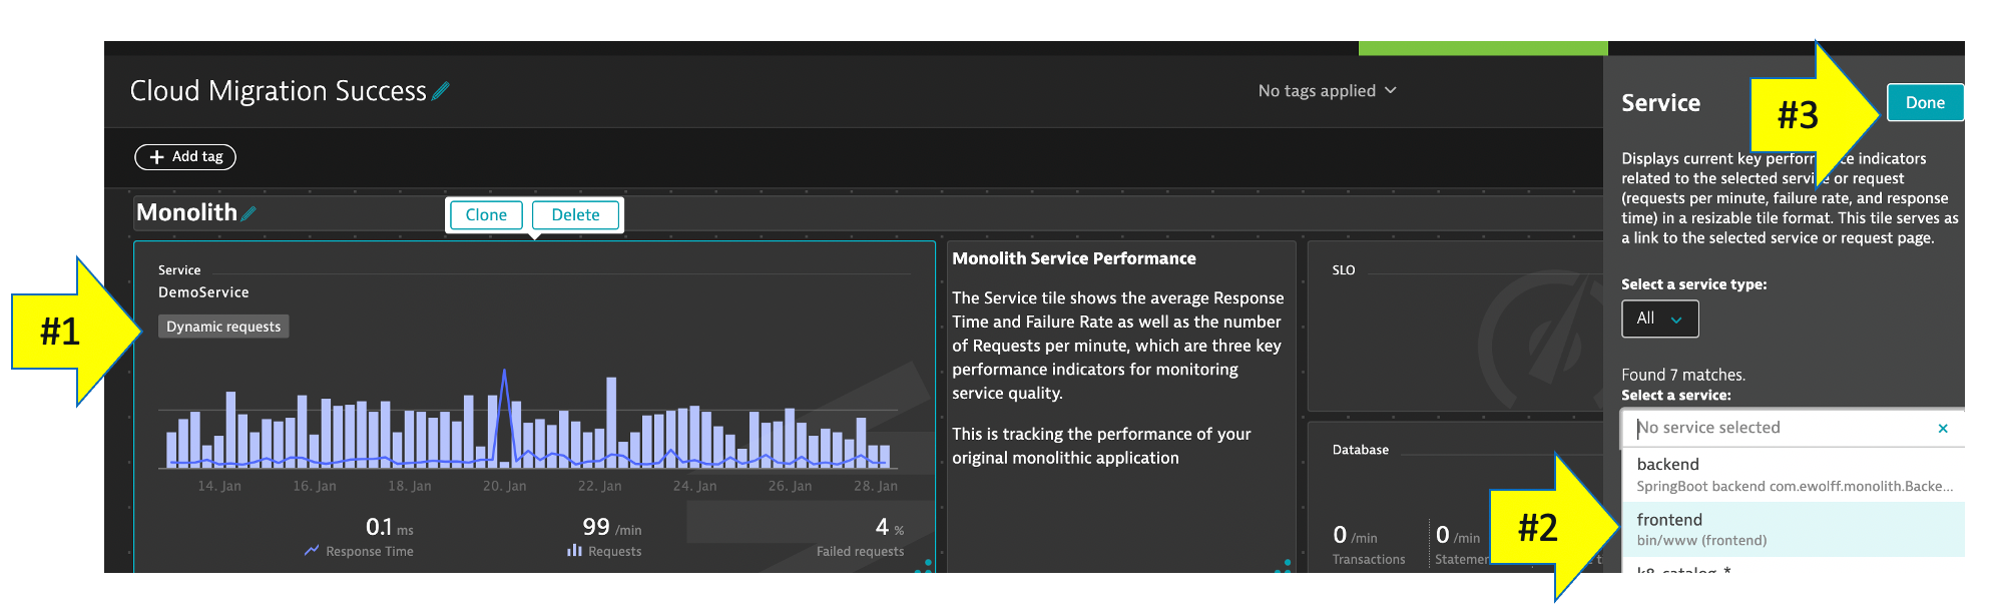
On the top right of the page, click the edit button and then follow these steps:
Edit Dynamic requests tile
- Click on the title of the Dynamic requests tile to open the Service properties window on the right side
- On the Service properties window, pick the monolith
frontend (monolith-frontend)service - Click the
Donebutton
Edit remaining tiles
- Repeat the same steps above for the Cloud services tile, but pick the
frontend (dev-frontend)in the Service properties window - Repeat for the two SLO tiles, but pick the associated SLO from the drop down list in the SLO properties window
- Repeat for the two database tiles. For Cloud services application there are 3 databases, so just pick one of the database of a demo.
- Click the
Donebutton to save the dashboard