Sample application Kubernetes details
Refer to this picture for a more detailed description of our setup.
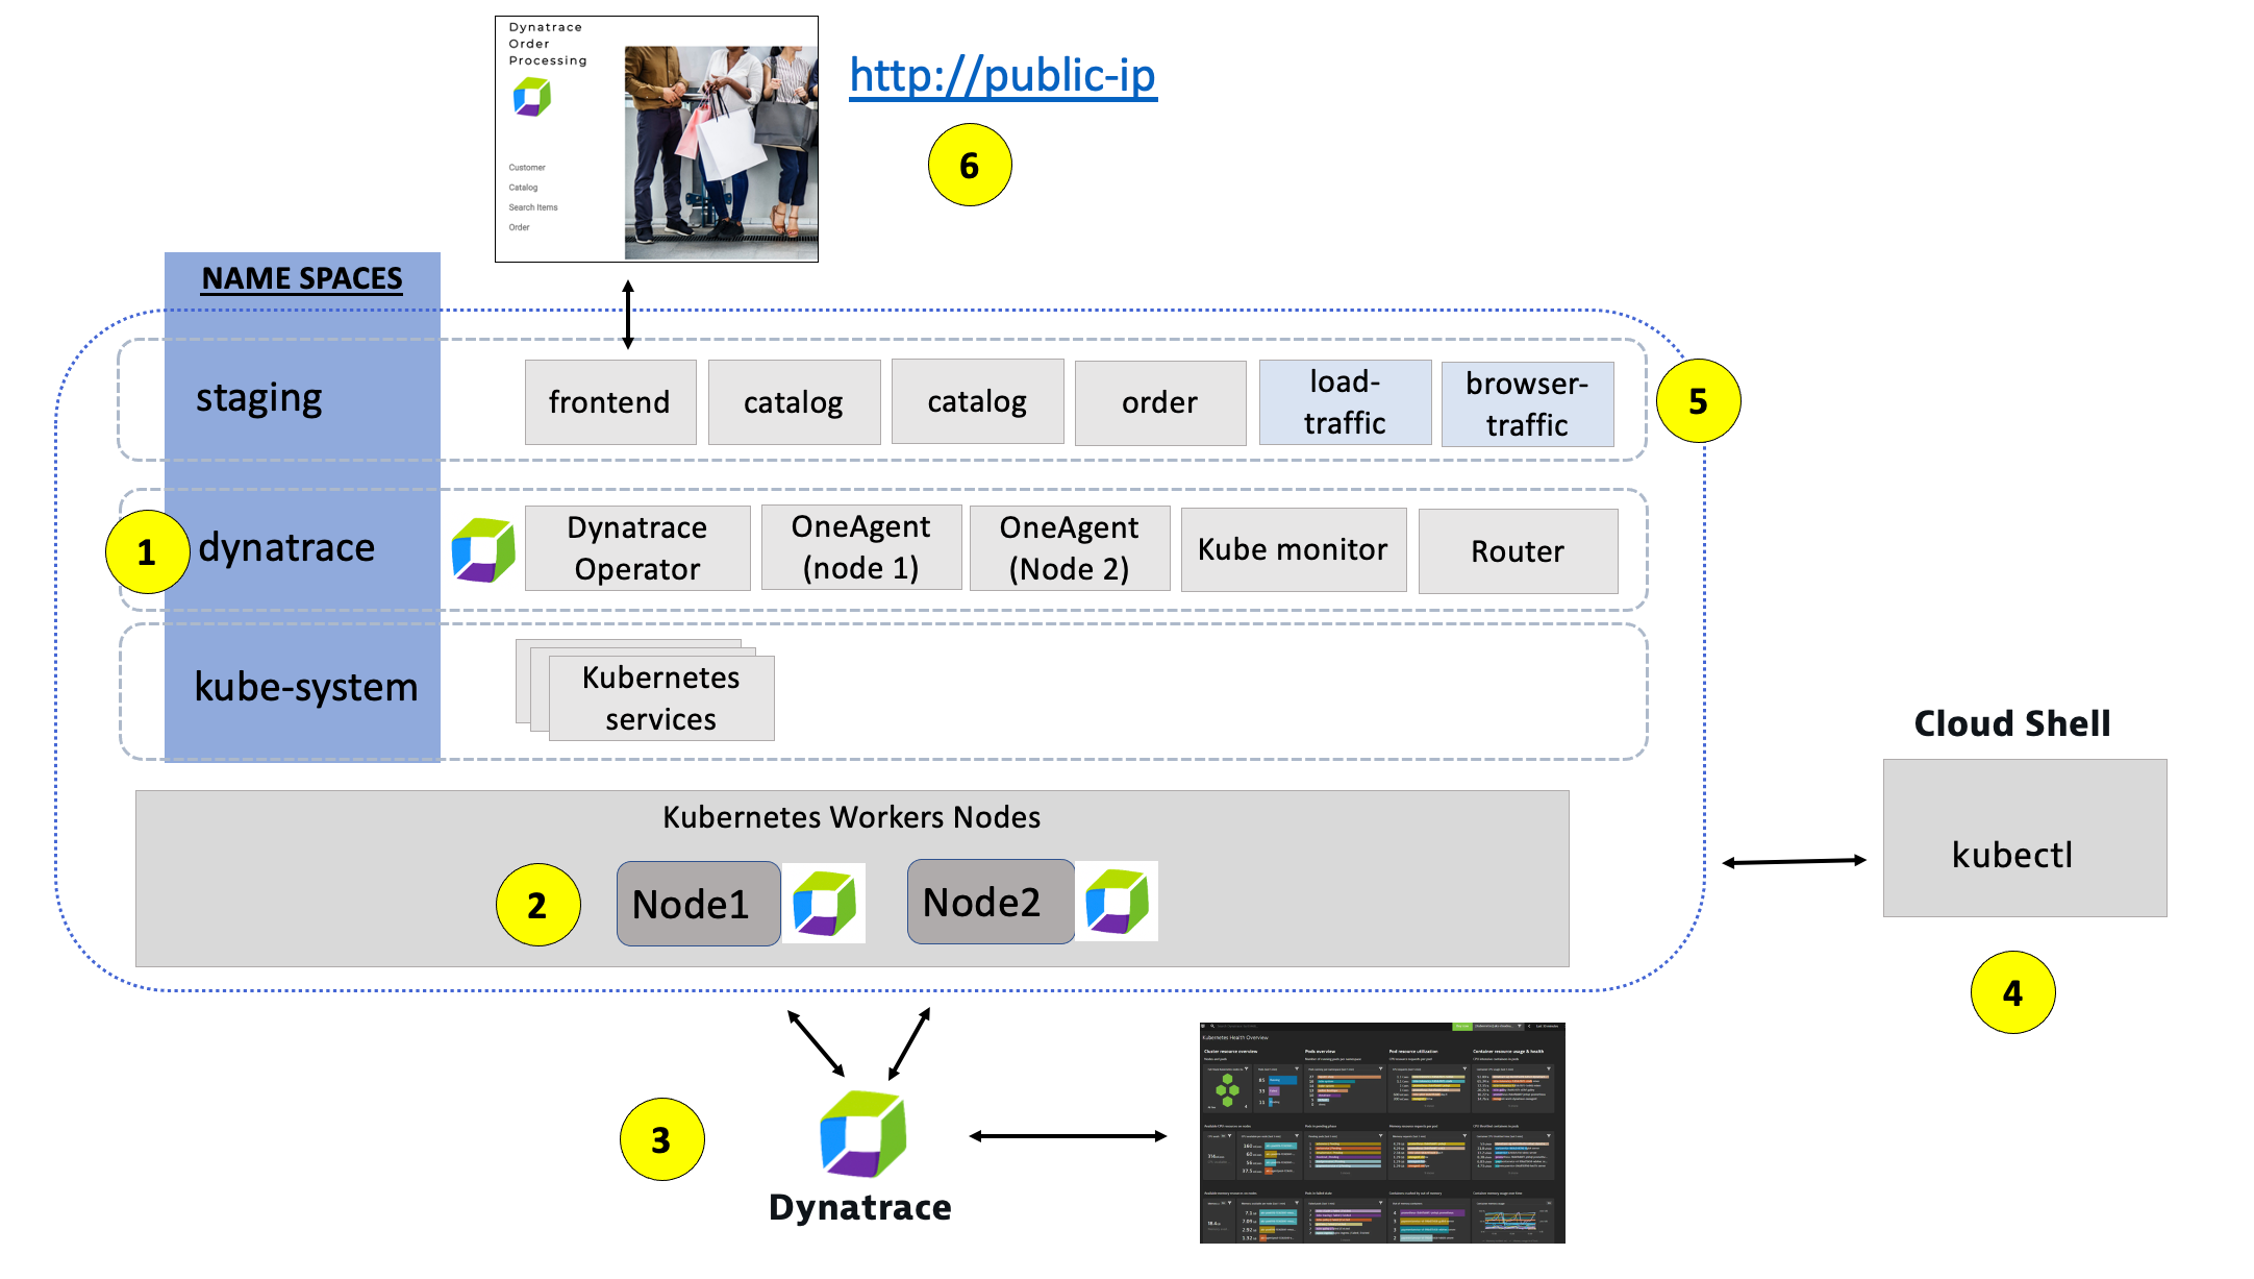
1 - Dynatrace Namespace
This Kubernetes Namespace contains the pods and services that make up the Dynatrace Operator.
2 - Kubernetes nodes
Kubernetes runs your workload by placing containers into Pods to run on Nodes.
3 - Dynatrace
Dynatrace tenant where monitoring data is collected and analyzed.
4 - Cloud shell
The shell is configured with the kubectl command line tool that lets you control Kubernetes clusters.
5 - Sample application namespace
This Kubernetes Namespace contains the sample application pods and services.
6 - Sample application
The frontend service is exposed as a public IP and is accessible in a browser.
Review sample app in a browser
To view the application, we need to get the IP to the Kubernetes service for the sample application. To do this, we need to run a kubernetes command.
From the SSH CLI SSH command prompt type this command
kubectl -n staging get svcExample output
NAME       TYPE           CLUSTER-IP       EXTERNAL-IP
catalog    ClusterIP      10.100.181.171   <none>
customer   ClusterIP      10.100.147.216   <none>
frontend   LoadBalancer   10.100.58.2      a6ebaa4a370e0468093167462c3aeab2-115097342.us-west-2.elb.amazonaws.com
order      ClusterIP      10.100.228.17    <none>
From the output, copy the entire value from EXTERNAL-IP and open it in a browser. This would be http://1a6ebaa4a370e0468093167462c3aeab2-115097342.us-west-2.elb.amazonaws.com for the example above.
Explore Sample app
Use the menu on on the home page to navigate around the application and notice the URL for key functionality. You will see these URLs later as we analyze the application.
- Customer List = customer/list.html
- Customer Detail = customer/5.html
- Catalog List = catalog/list.html
- Catalog Search Form = catalog/searchForm.html
- Order List = order/list.html
- Order Form = order/form.html
💥 TECHNICAL NOTE
The application looks like this monolith, but notice how the home page shows the versions of the three running backend services. You will see these version updated automatically as we deploy new versions of the backend services.