About Smartscape
Enterprises have many hosts, services, and application that are ever changing. The ability to automatically discover and change as the environment changes is a key feature that Smartscape delivers.
Dynatrace’s near real-time environment-topology visualization tool, Smartscape, is where Dynatrace’s auto-discovery is delivered into a quick and efficient visualization of all the topological dependencies in your infrastructure, processes, and services.
👍 How this helps
Smartscape shows all the dependencies of a given service. Those include connections to queues, web servers, app servers, and a native process. The host view shows historical and live time-series data for usage as well as the consuming processes. This information allows us to better plan the migration, as all depending services must be considered during the migration.
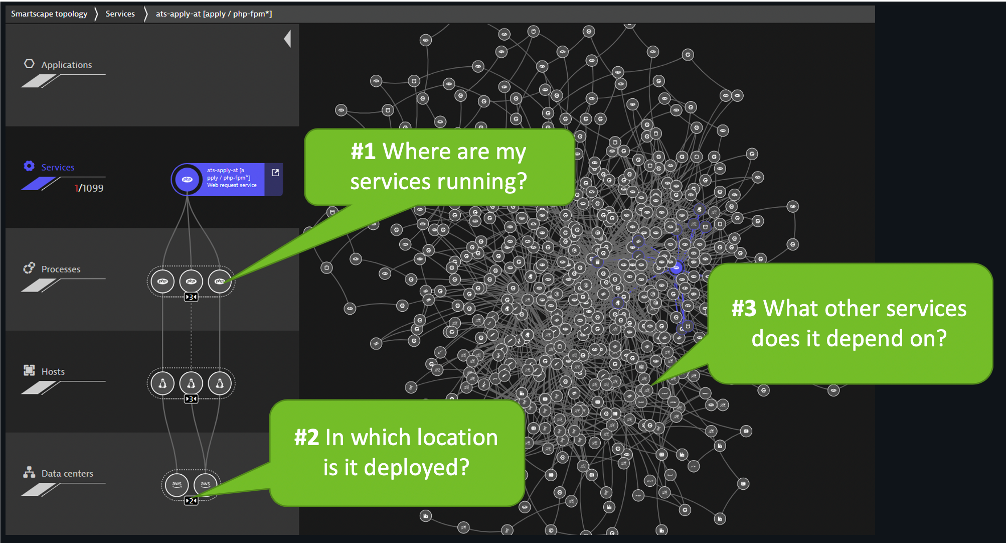
Referring to the picture above:
- On the horizontal axis, it visualizes all ingoing and outgoing call relationships within each tier
- On the vertical axis, it displays full-stack dependencies across all tiers
- Data center
- Hosts
- Process
- Service
- Application
Review Smartscape
Let’s see how Dynatrace can visualize these processes using Smartscape.
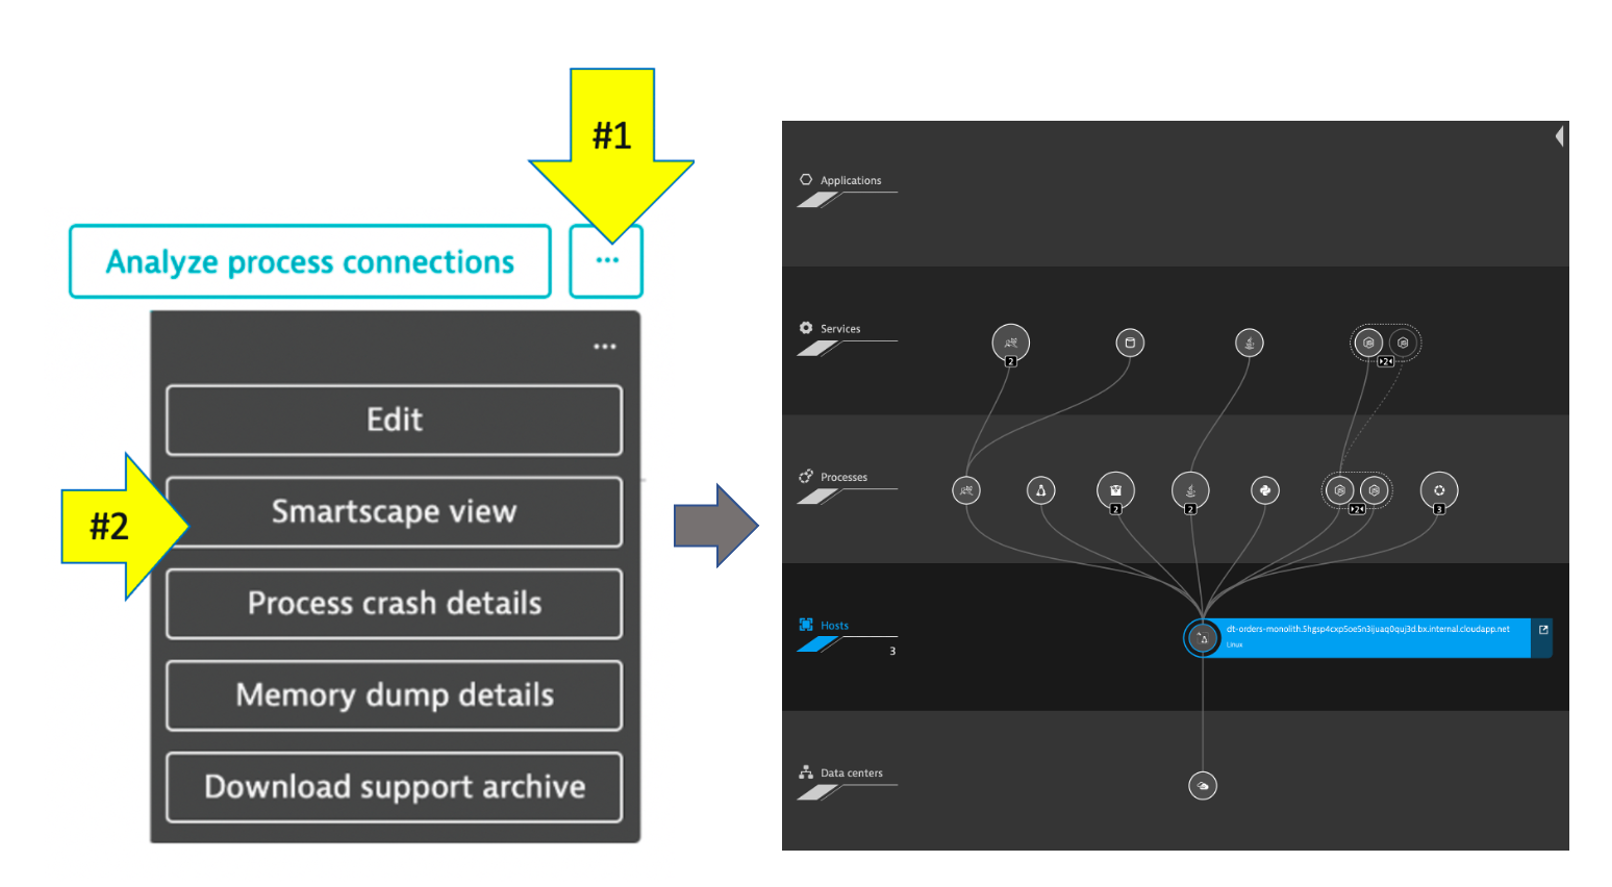
- Be sure you are on the
dt-orders-monolithhost page - Just click on the
...box on the to the right of the host name - pick
Smartscape viewmenu option - this will open Smartscape filtered to this Host Instance
Feel free to explore the Smartscape.