Custom Metrics Events
Custom Metrics Events
Dynatrace Davis automatically analyzes abnormal situations within your IT infrastructure and attempts to identify any relevant impact and root cause. Davis relies on a wide spectrum of information sources, such as a transactional view of your services and applications, as well as all on events raised on individual nodes within your Smartscape topology.
There are two main sources for single events in Dynatrace:
- Metric-based events (events that are triggered by a series of measurements)
- Events that are independent of any metric (for example, process crashes, deployment changes, and VM motion events)
Custom metric events are configured in the global settings of your environment and are visible to all Dynatrace users in your environment.
1. Setup Custom metric alerting for AWS
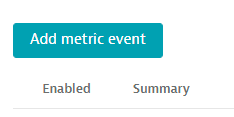
1 . To add custom alerts, navigate to Settings --> Anomaly Detection --> Metric events menu.
2 . Click the Add metric events button.
3 . Fill in the below information on the Add metric event template
- Summary:
CPU % percentage - Type:
Metric keyfrom dropdown - Metric key
EC2 CPU usage %from dropdown - Agregation
Averagefrom dropdown - Management zone
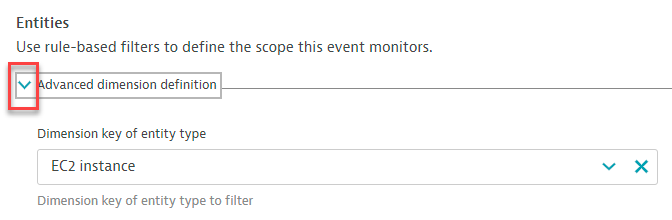
dt-orders-monolith - under entities click on
>to seeDimension key of entity typeand selectEC2 instancefrom dropdown
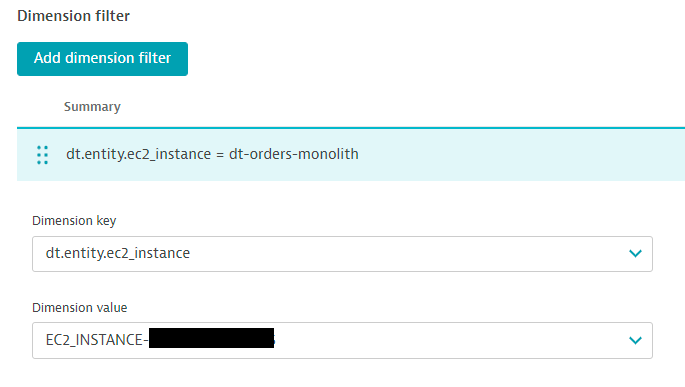
- Dymension filter click on
Add dimension filterand select as shown below.
- under Monitoring strategy section select as shown.
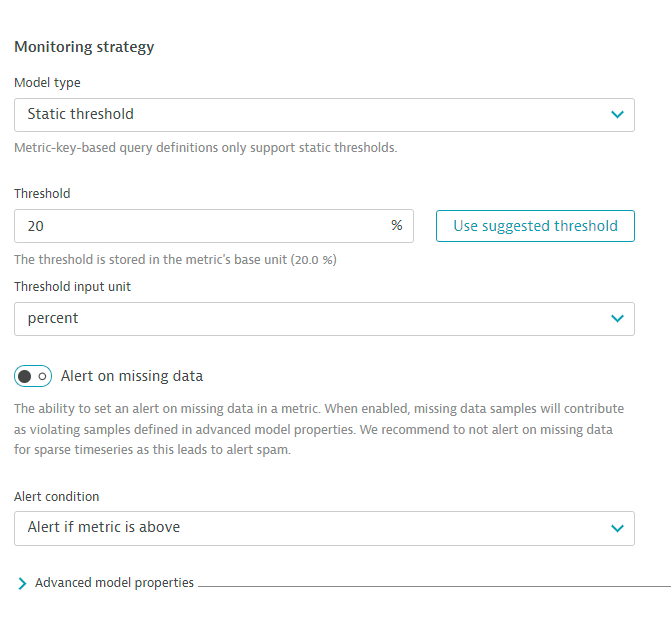
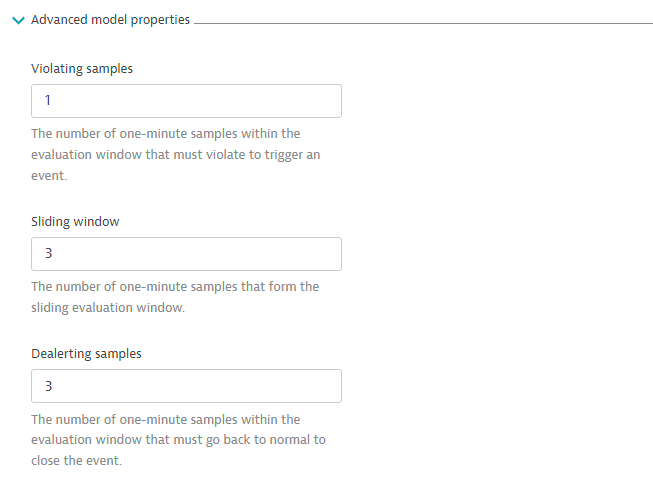
- select the
>next toAdvanced model propertiesand input as shown.
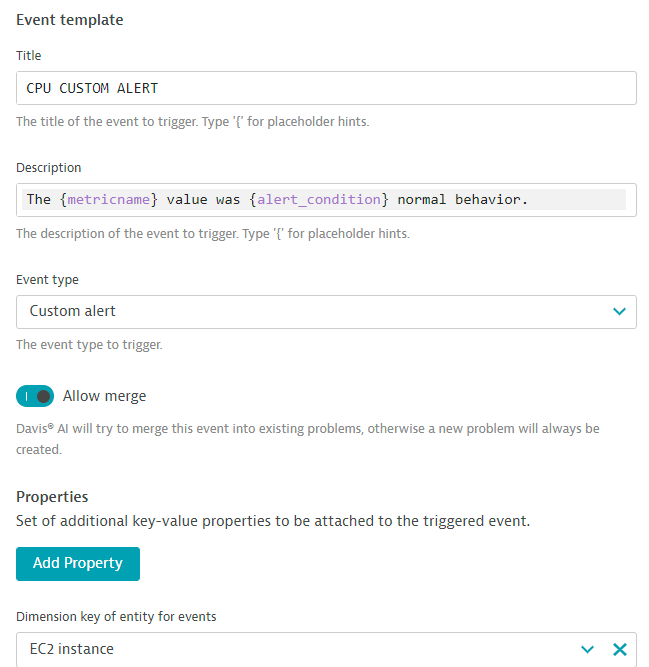
- In the
Event templatesection add:- Title:
CPU CUSTOM ALERT - Event type from dropdown:
Custom alert - Dimension key of entity for events select
EC2 instancefrom dropdown
- Title:
- click on
Save Changes
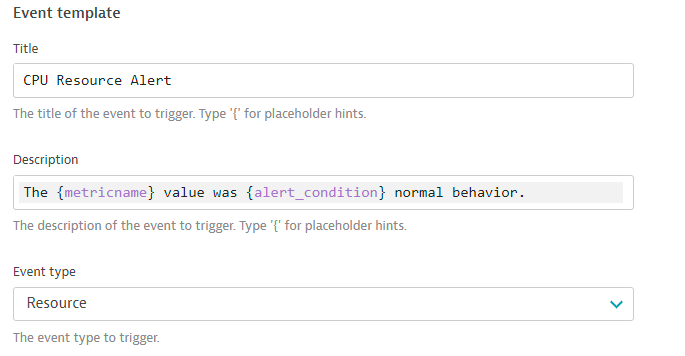
4 . Add another rule, with everything the same, except for the Event Description to have the title as CPU Resource Alert and Event type = RESOURCE as shown below.
- toggle the
Alert on missing datatooff
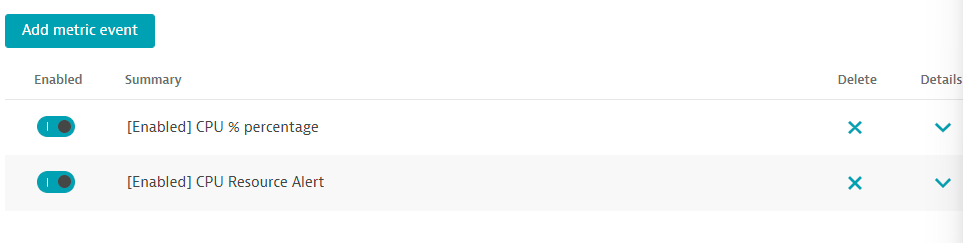
5 . Save your changes and the list should look as shown below.