Dynatrace Modernization Workshop > Lab 7 - Modernization with Kubernetes > Analyze Service flow on Kubernetes
Analyze Service flow on Kubernetes
Analyze Service flow on Kubernetes
Duration: 5
In this step we will walk through the Service Flow view within Dynatrace and see what’s different now that its deployed on Kubernetes.
Tasks to complete this step
-
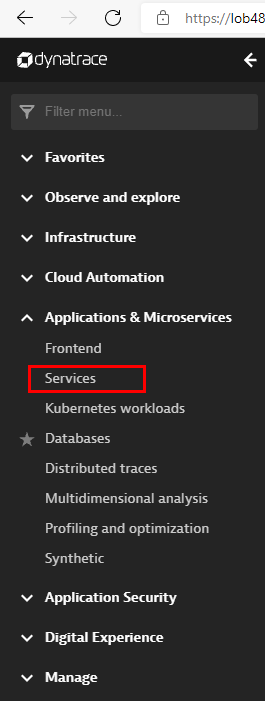
Review Services View for
Frontendservice- Left Menu -> Applications & Microservices -> Services
- Top Menu -> filter by
dt-orders-k8 managementzone.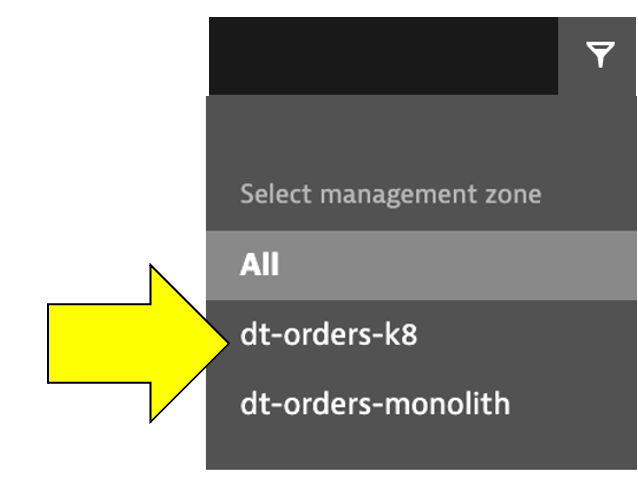
- Pick the
frontendservice.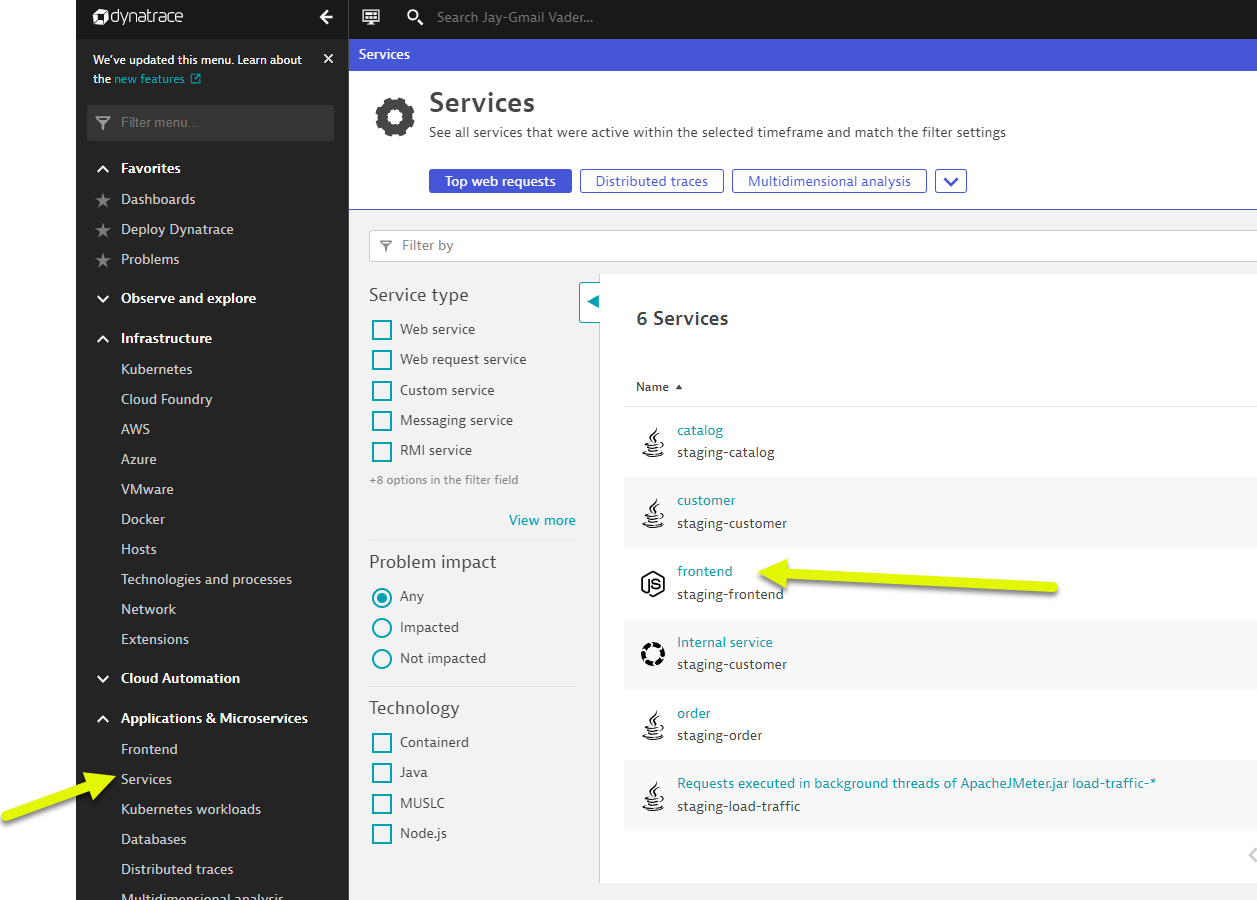
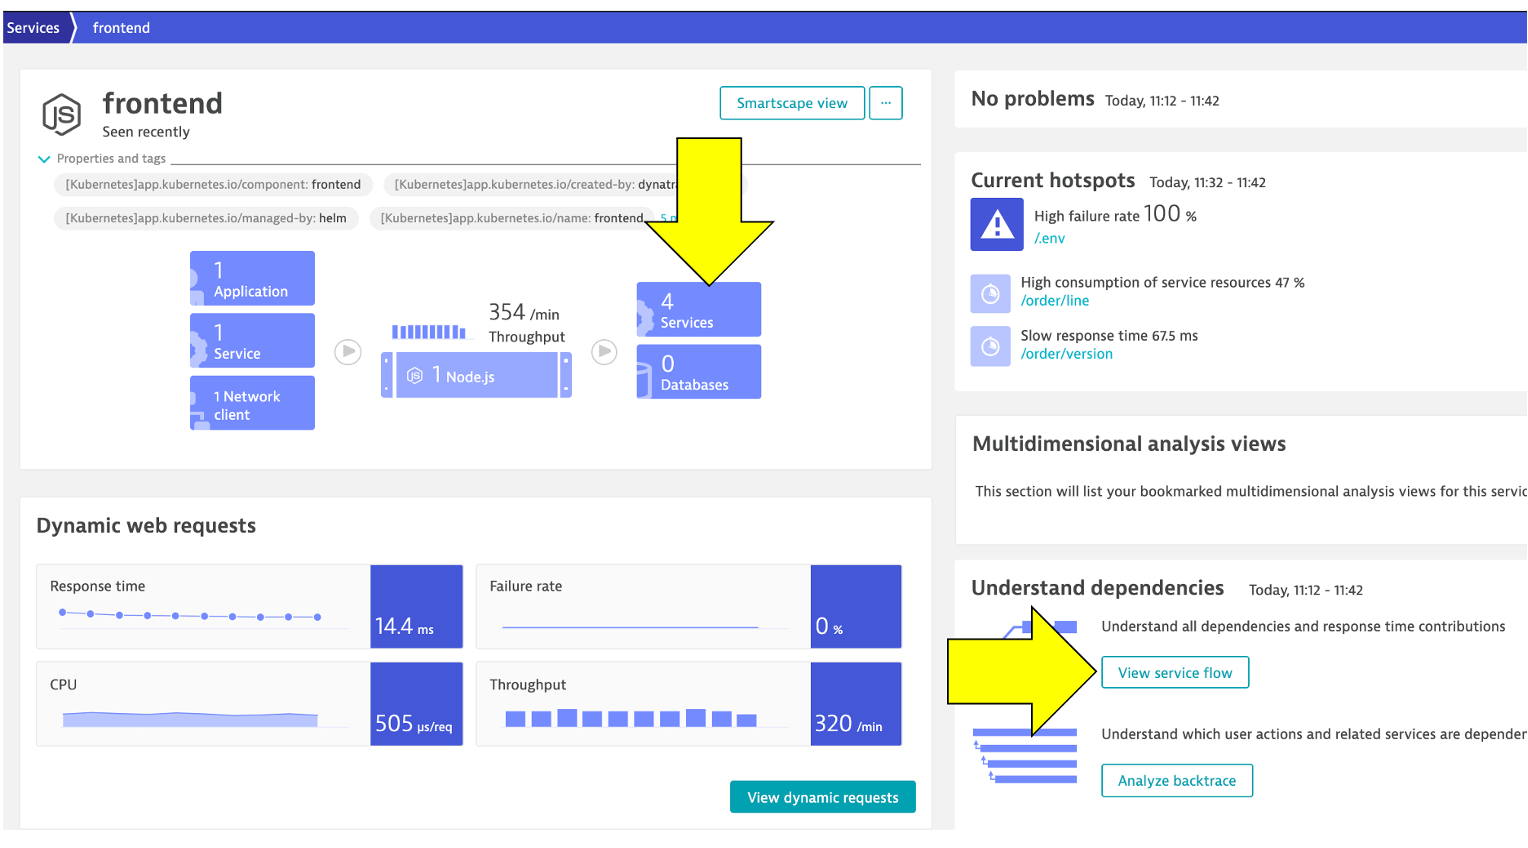
- Just click on the view service flow button to open this.
- Left Menu -> Applications & Microservices -> Services
-
Analyze Services view from Response time perspective
-
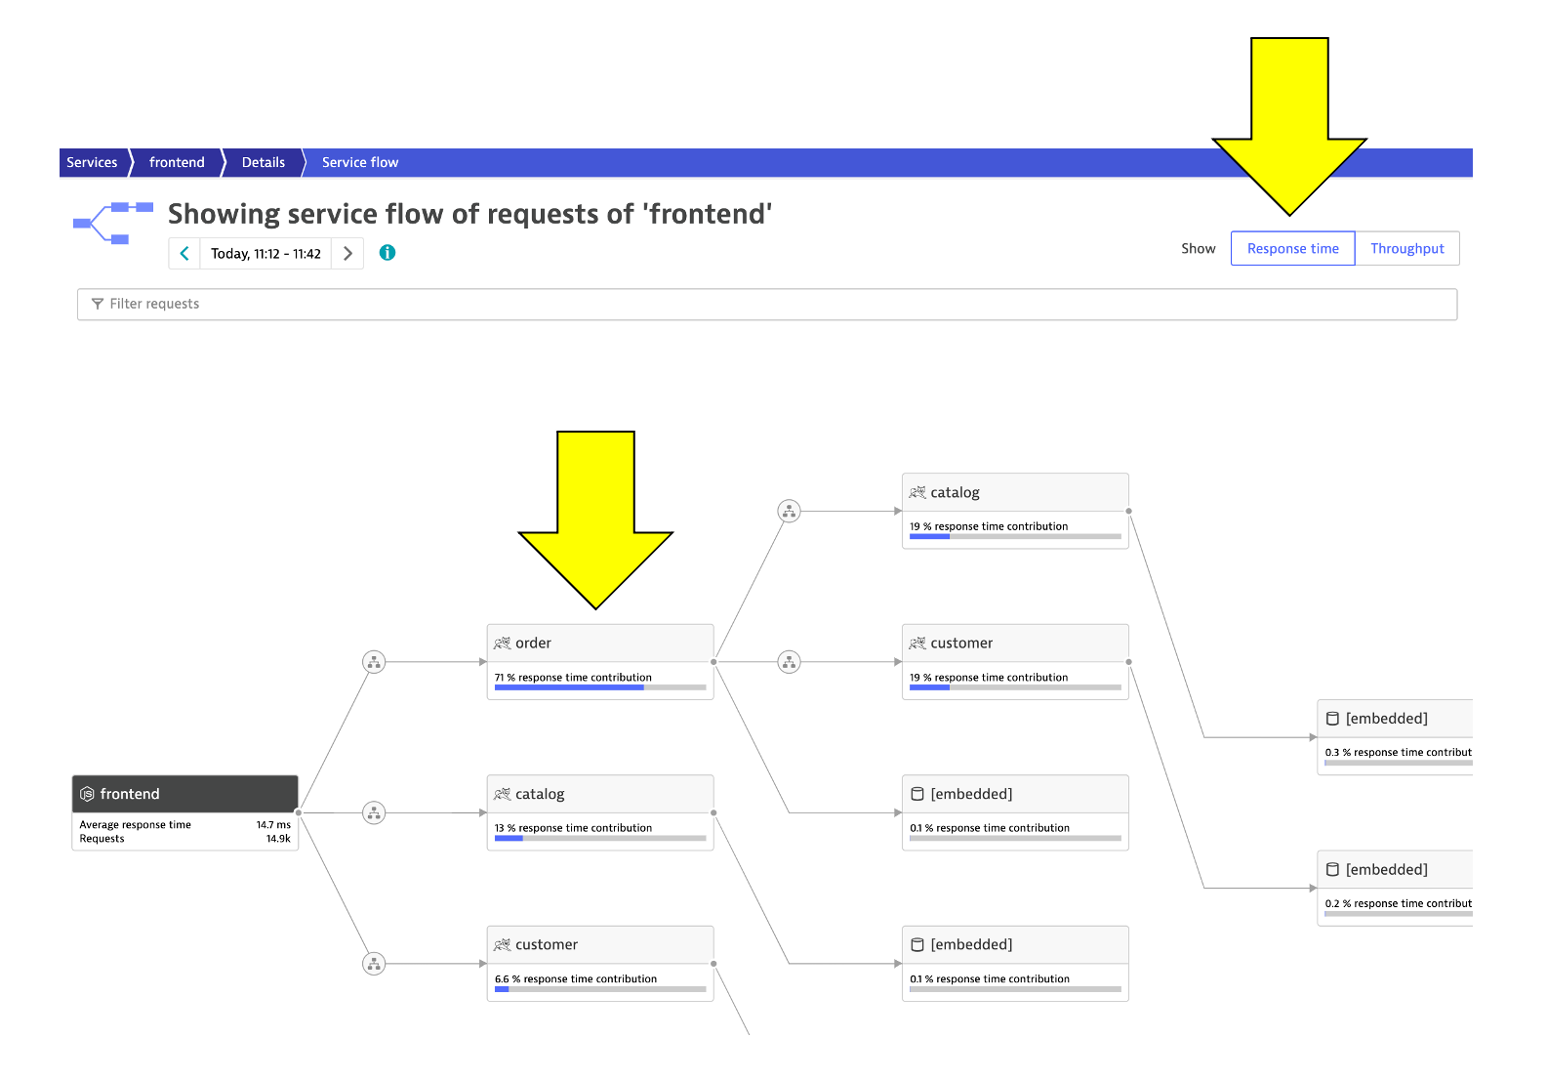
You should now be on the Service flow page.
-
Right away, we can see how this application is structured:
- Frontend calls order, customer, and catalog service
- Order service calls order and customer service
-
Something you would never know from the application web UI!
-
Refer to the picture above:
- We are viewing the data from a Response time perspective. Shortly, we will review the Throughput perspective.
- Click on the boxes to expand the response time metrics. Most of the response time is spent in the order service and the least in the customer services. And as in the simple version of the application, a very small amount of the response time is spent in the databases.
-
-
Analyze Services view from Throughput perspective
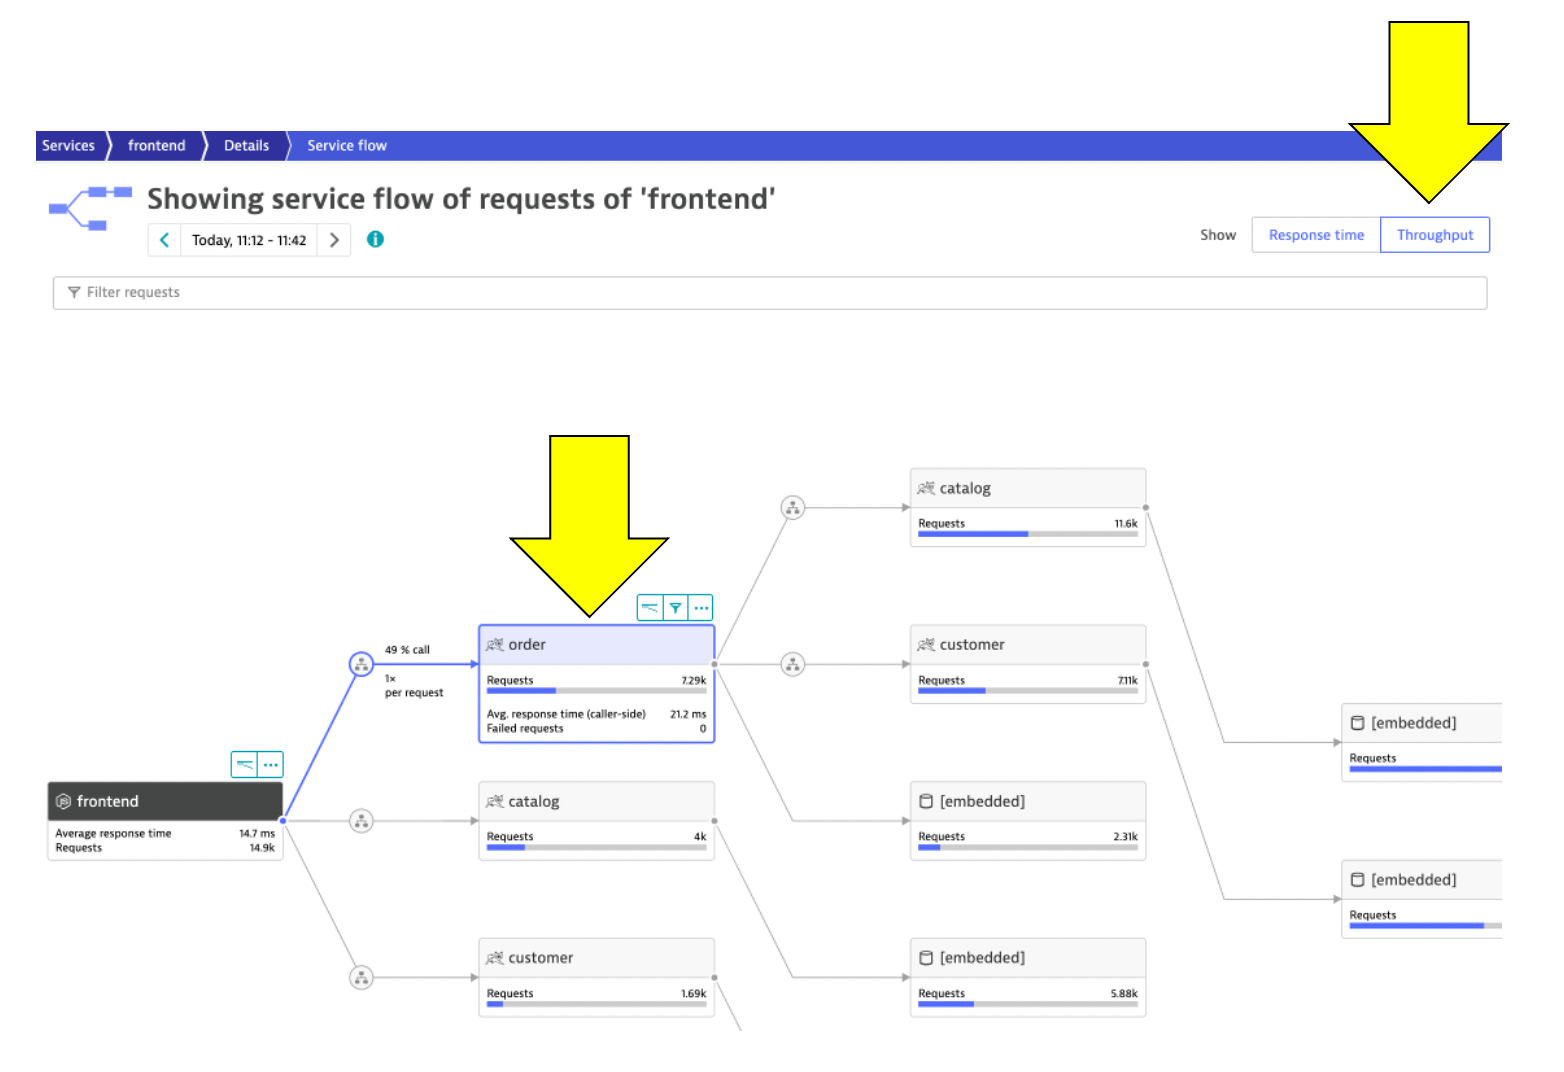
- Refer to the picture above:
- Change to the Throughput perspective by clicking on the box
- Click on the boxes to expand the metrics to see the number of requests and average response times going to each service
- Refer to the picture above:
👍 How this helps
Reviewing the architecture before and after changes is now as easy as a few clicks!