AWS Dashboard
AWS Dashboard
In addition to monitoring your AWS workloads using OneAgent, Dynatrace provides integration with AWS CloudWatch which adds infrastructure monitoring to gain insight even into serverless application scenarios.
👍 How this helps
Dynatrace brings value by enriching the data from AWS CloudWatch extending observability into the platform with additional metrics for cloud infrastructure, load balancers, API Management Services, and more.
These metrics are managed by Dynatrace’s AI engine automatically and this extended observability improves operations, reduces MTTR and increases innovation.
Here is an example from another environment.

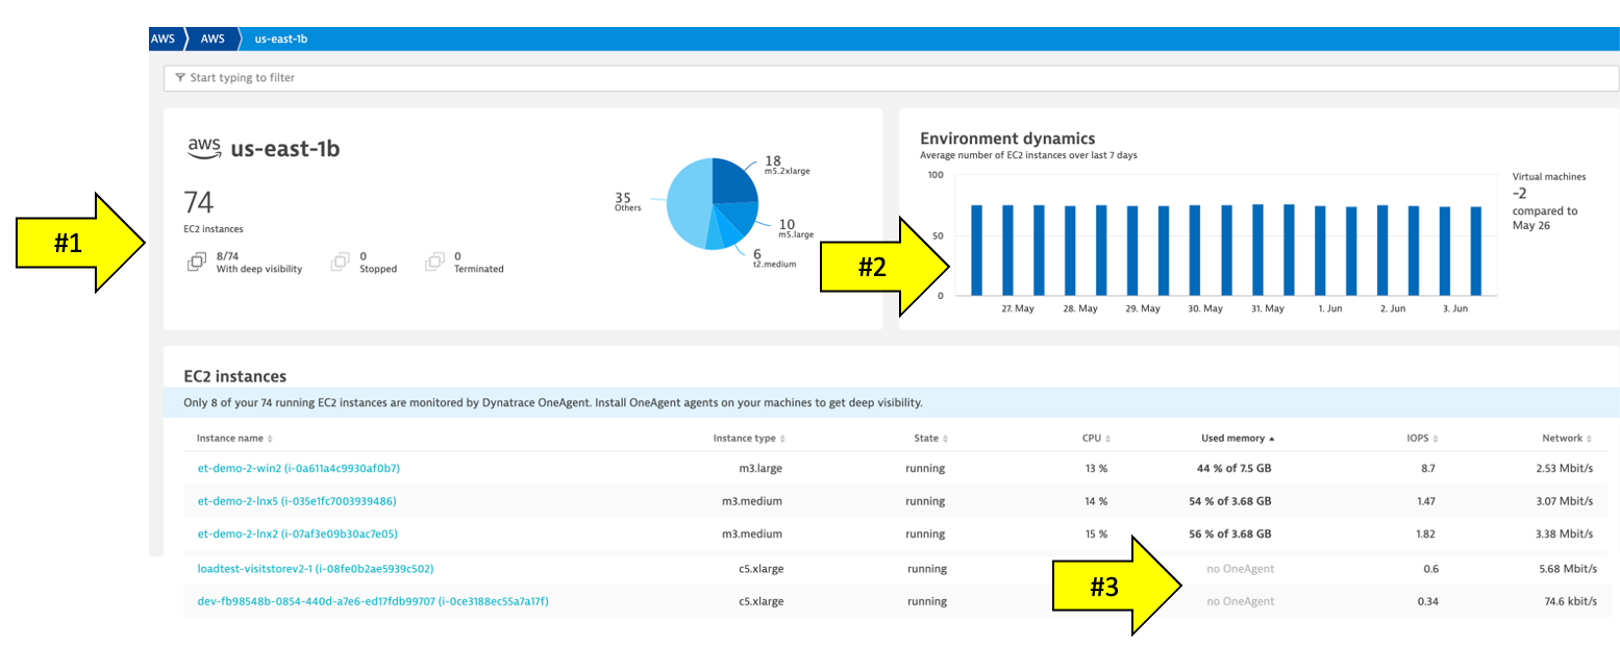
Hosts regional page
Notice the following details:
- A summary of type and status is shown
- A running average for virtual machines
- A table of host with AWS monitor metrics summarized. Notice that both hosts with and without an OneAgent are both shown
EC2 example
Here is an example of a host with no OneAgent.
Notice the following details:
- Expand the properties to see more details
- All the AWS CloudWatch metrics are viewable as time-series data

Lambda example
Here is a list of the Lambda functions. Notice tags and time-series data.

Preset dashboards
As AWS services are enabled, Dynatrace will enable preset dashboards automatically. These can be cloned and customized or hidden as required. Here is one example:

To see more dashboards, navigate to this repository:
Lab Setup: We will not execute this part of the lab as we have automated the creation of a proxy known as the Dynatrace Activegate and creating the necessary AWS policies and roles that are needed for the Cloudwatch configuration. You can see all the magic in the Git repo you copied in Lab 0 in the provision-scripts/provision-workshop.sh file. However we will show you the steps so you are familiar and can reference them should you need them for other purposes. Hands on will resume on step 3 of this lab.
There are several ways one can configure the Dynatrace AWS monitor, but for this workshop we will use a quick solution using AWS role based access by creating and executiung a Cloud Formation Template by following these basic steps:
- Download the Dynatrace_Monitoring_Role file from the github repository
- Create AWS Role for monitoring
- Create Dynatrace AWS connection with role based acces
Step 1 of 3: Download the Dynatrace_Monitoring_Role file from the below github repo
https://github.com/dt-alliances-workshops/aws-modernization-dt-orders-setup/blob/main/provision-scripts/cloud-formation/dynatrace-role-access.yaml
- Copy the contents of the script by clicking on the copy button
- Paste the contents in a fresh notepad and save it as
dynatrace-role-access.yamlin your desktop

Step 2 of 3: Create AWS Role for monitoring
The AWS monitoring role defines the minimum scope of permissions you need to give to Dynatrace to monitor the services running in your AWS account. Create it once and use anytime when enabling Dynatrace access to your AWS account.
1 . From your amazon console home type cloudformation and select Stacks.

2 . Select the Create stack dropdown and click on With new resources (standard).

3 . On the Create stack page, select radio buttons for Template is ready and Upload a template file.
4 . Next, Click the Choose file button and select the dynatrace-role-access.yaml file you saved in the earler step.
5 . Click on Next.

6 . On the Specify stack details enter the stack name as DT-monitoring-role and in the Parameters section paste the ExternalID you copied earlier from the Cloud and Virtualizatoin -> AWS integration page in the Dynatrace platform and click next.

7 . On the Configure stack options click Next.
8 . On the Review DT-monitoring-role notice the parameters fileed out with your info including the ExternalID. Finally, aknowledge and Submit.


9 . On the Stacks page you will see the Create_Complete message in the status.
Step 3 of 3: Create Dynatrace AWS connection with role based acces
Dynatrace can use role based access to make secure REST or Query protocol requests to the AWS service API. You’ll now need to return to the Dynatrace portal to finalize your integration and make the connection that it can use to get metrics from Amazon Web Services.
- From the Cloud and Virtualizatoin -> AWS integration page on the Dynatrace portal add the following bits of information:
- Connection Name:
Dynatrace Integration - IAM Role:
Dynatrace_monitoring_role - Your AWS account ID: found on the AWS console top right hand dropdown.
- Click
Connect
- Connection Name:

- Once the connection is successfully
verifiedand saved, your AWS account will be listed in theCloud and virtualizationsettings page. If successful, your should see the configuration now on theAWS connectionspage:
