Analyze Service Backtrace on Kubernetes
Analyze Service Backtrace on Kubernetes
Duration: 5
Now that we’ve modernized the application and installed it on Kubernetes, we still need to trace the application transactions from front to back.
Dynatrace understands your applications transactions from end to end. This transactional insight is visualized several ways like the backtrace.
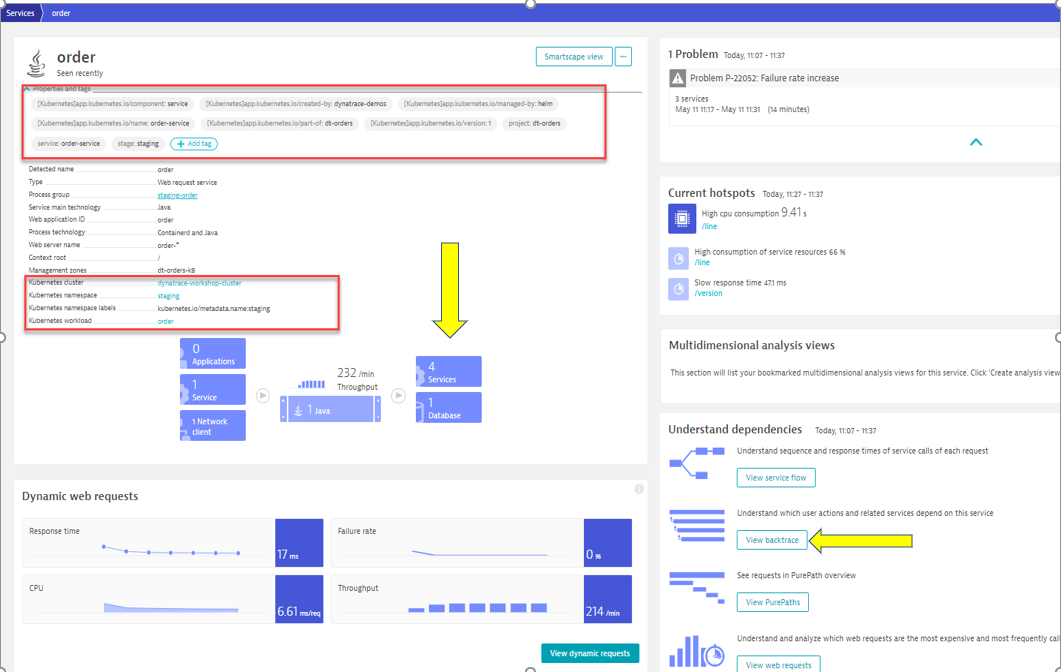
The backtrace tree view represents the sequence of services that led to this service call, beginning with the page load or user action in the browser.
Dynatrace also gives you insight into what Kubernetes cluster, node, workload, and namespace that service is running on.
👍 How this helps
The service flow and service backtrace give you a complete picture of interdependency to the rest of the environment architecture at host, processes, services, and application perspectives.
Tasks to complete this step
-
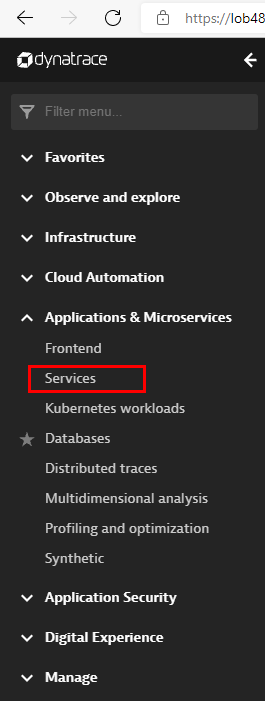
Review Services View for
orderservice- Left Menu -> Applications & Microservices -> Services
- Top Menu -> filter by
dt-orders-k8 managementzone.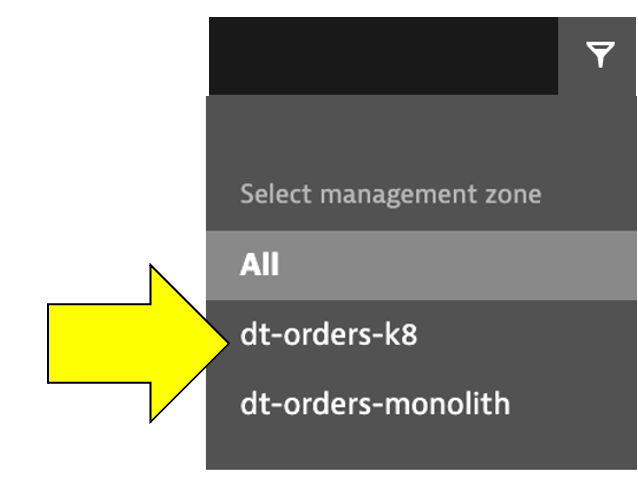
- Pick the
orderservice.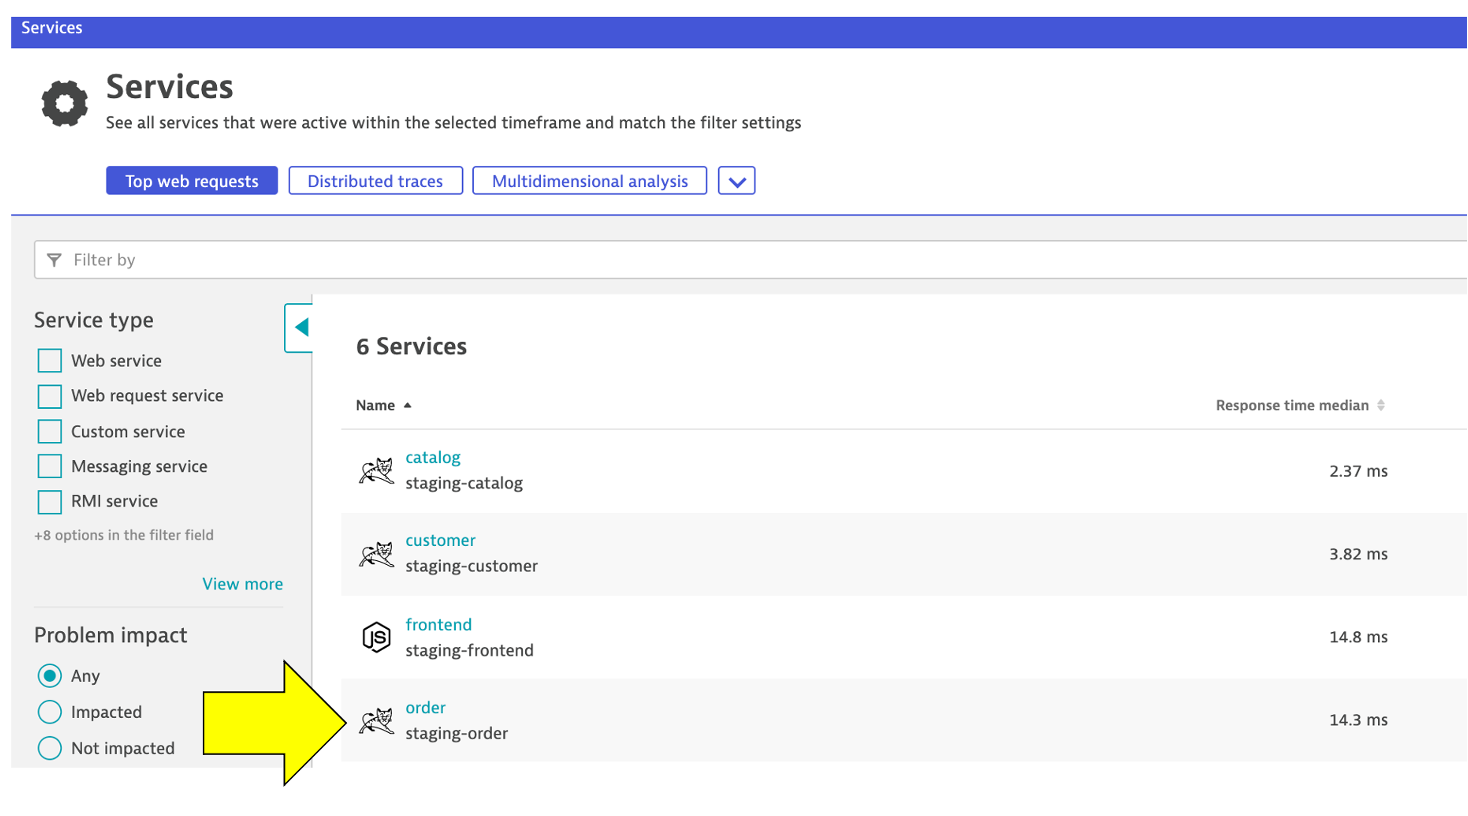
- On this service, we can quickly review the inbound and outbound dependencies.
- Referring to the picture, within the services infographic, click on the “services” square to get a list of the services that the order service calls.
- Left Menu -> Applications & Microservices -> Services
-
Review Backtrace View
- To see the backtrace page, just click on the Analyze Backtrace button.
- You should be on the service backtrace page where you will see information for this specific service.
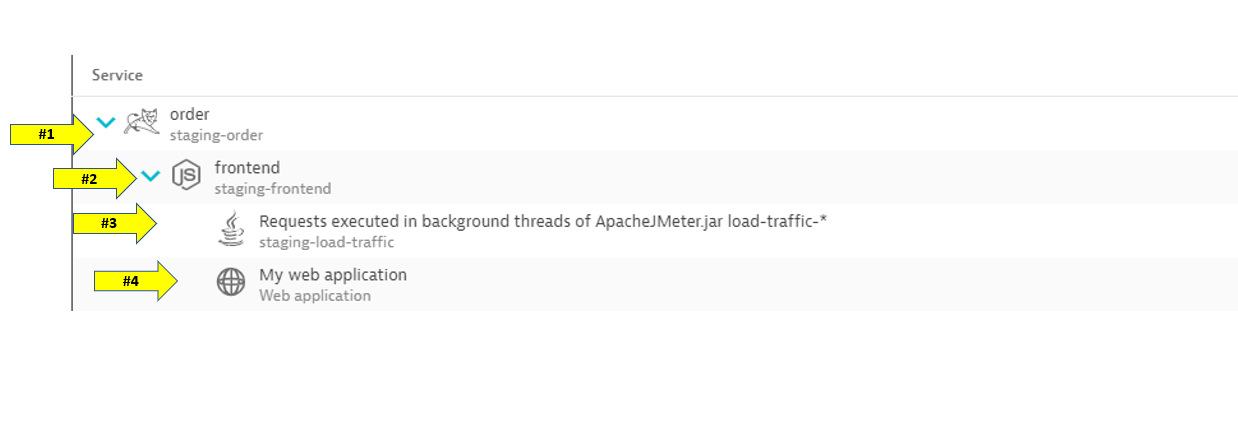
- This will get more interesting in the next lab, but for the monolith backend, we can see that the backtrace is as follows:
- The starting point is the backend
- Backend service is called by the front-end
- Front-end is a where end user requests start and the user sessions get captured
- My web application is the default application that Dynatrace creates