Services
Web applications consist of web pages that are served by web servers and web application processes, for example Tomcat. Web and mobile applications are built upon services that process requests like web requests, web service calls, and messaging.
Such “server-side services” can take the form of web services, web containers, database requests, custom services, and more. Services may in turn call other services such as web services, remote services, and databases services.
👍 How this helps
As you plan your migration, it is important to gain a complete picture of interdependency to the rest of the environment architecture at host, processes, services, application perspectives. Since time is always scarce, being able to do this in a single place can shorten assessment timelines.
Services
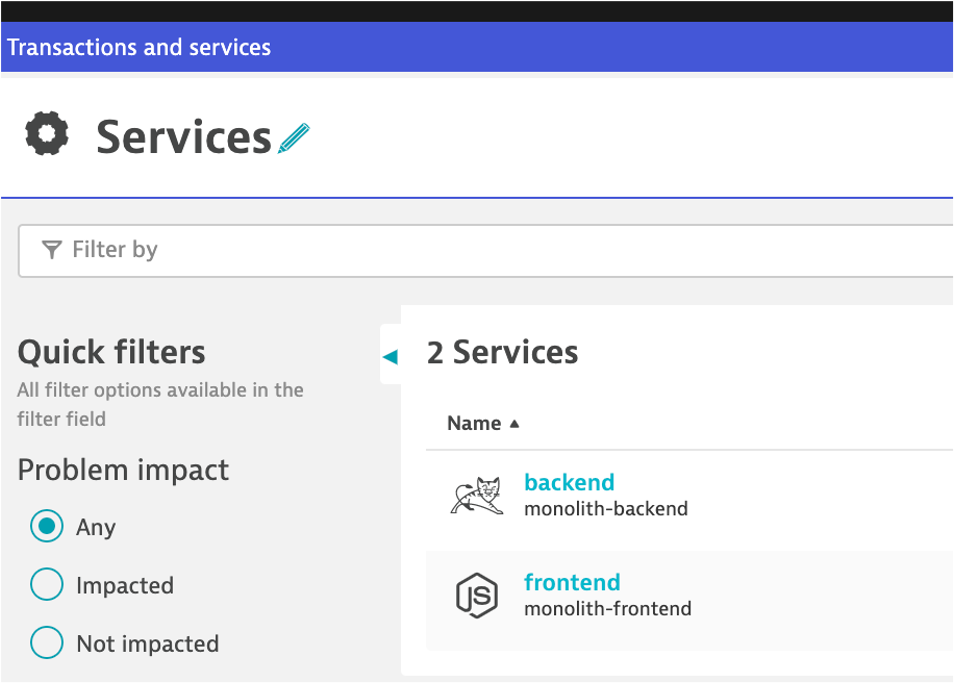
Let’s now take a look at all the services being monitored by clicking on the Services left side Dynatrace menu.
The filtered list should now look like this:
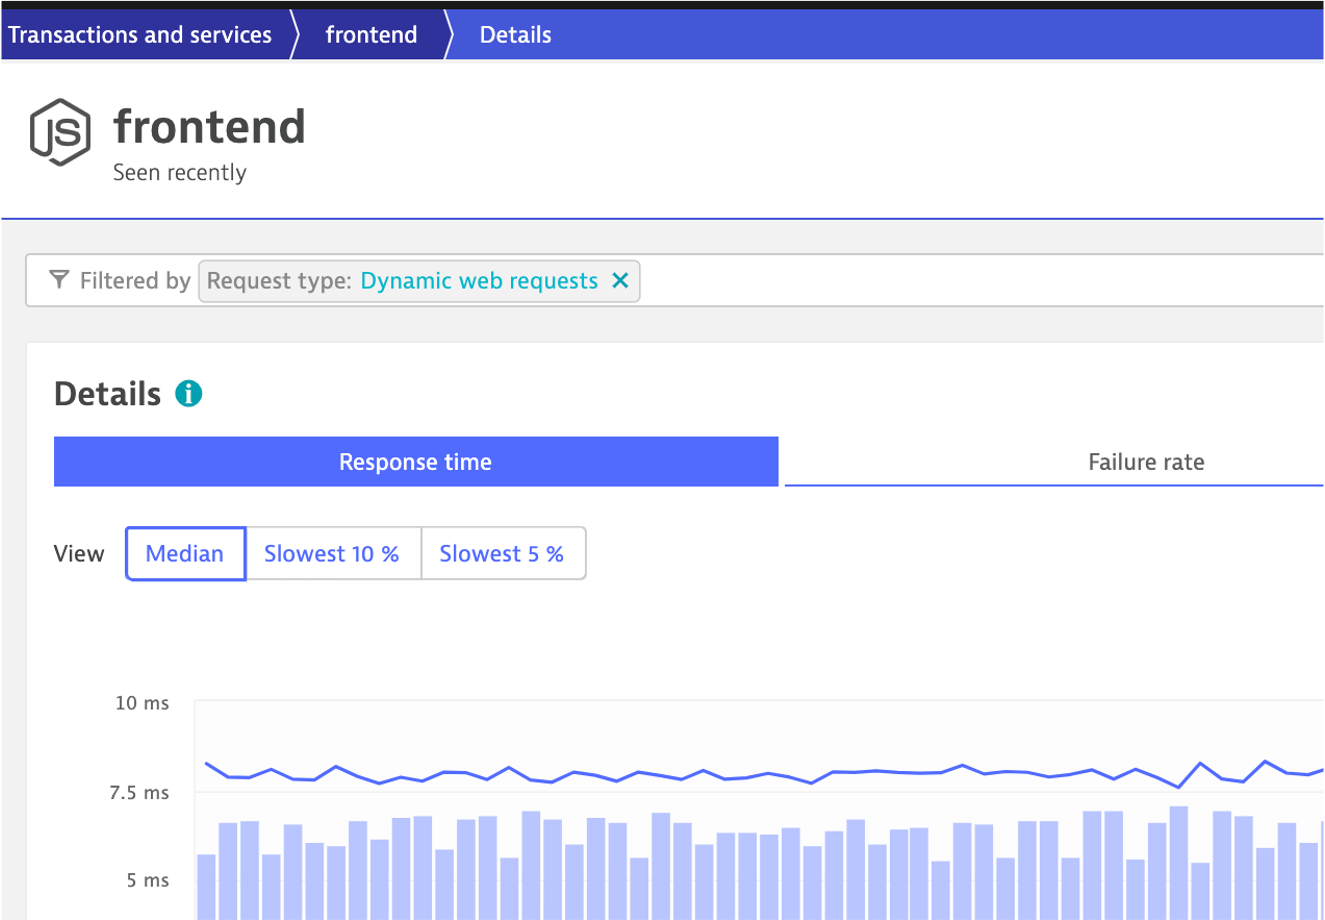
Choose the frontend service.
On the frontend service page, find the Dynamic Web Requests section on the right and click the view Dynamic Requests button to see what it calls.
![]()
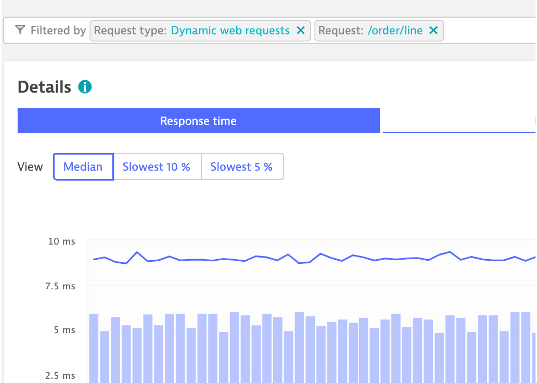
On this page you can view the transactions as time-series charts.
On this page you can view the “top requests” and their response time consumption. You should recognize the URLs from the sample app!
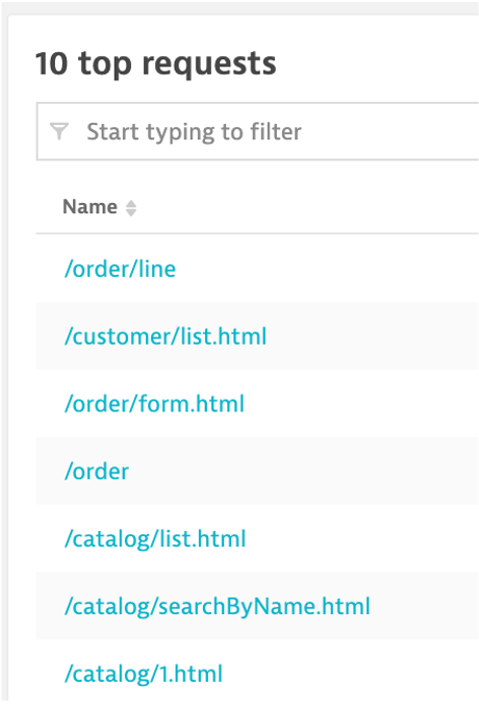
By clicking on one of the requests, the time-series charts are filtered to just that one request.
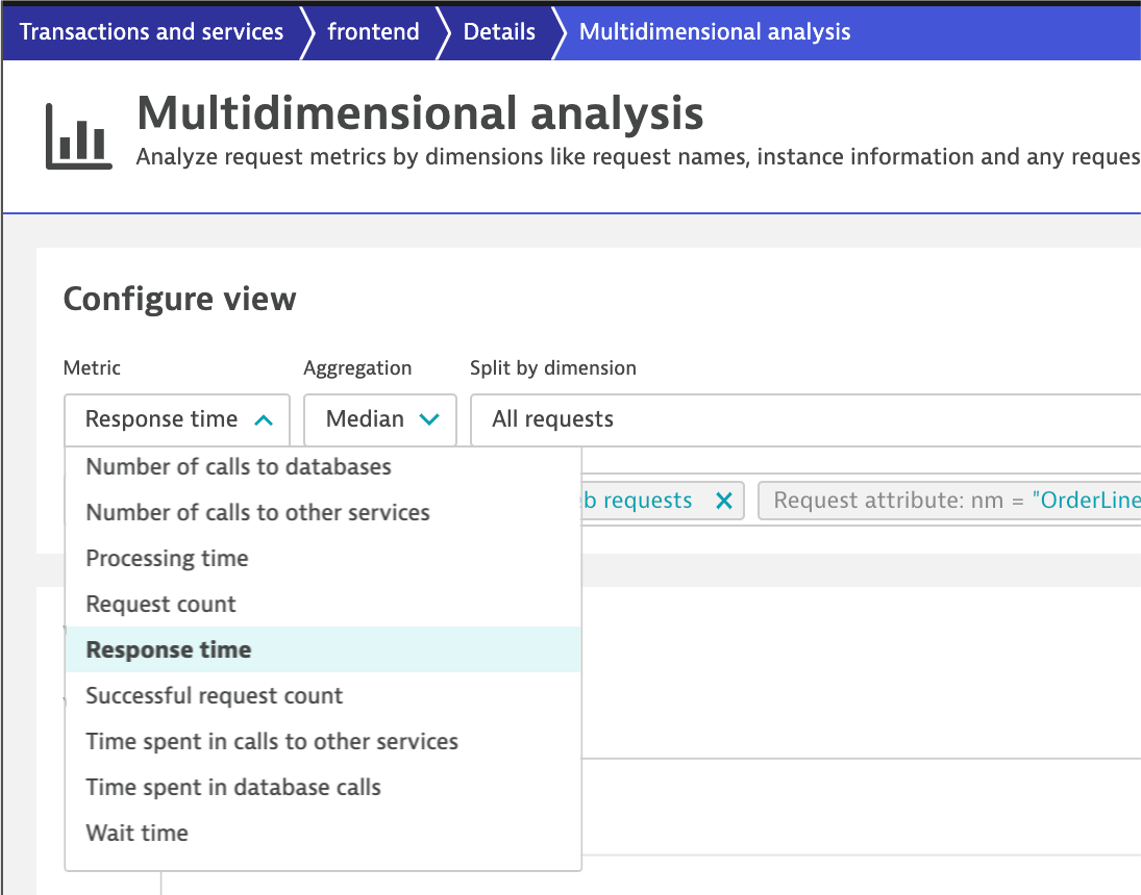
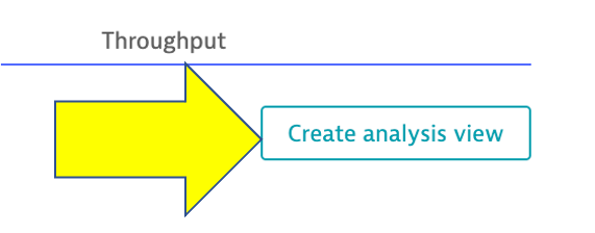
Analysis View
On the top if the page on the right is a button labeled Create Analysis view, click that.
Tryout the options available to view, filter and analyze data.