Process
In the Smartscape view, we saw the visualizations of the relationships in vertical stack and as well as the relationships spatially. Now let’s view the processes and services running on the host.
As you plan your migration, you need more than just host level metrics. Knowing the details for each service, BEFORE you change it, will lower the risk of impacting the business.
👍 How this helps
Very quickly we have seen what processes and services are running on a host AND more importantly, what processes and services call (outbound) and are being called (inbound). Having a real-time picture is certainly more accurate that out of date documentation.
Lets Review!
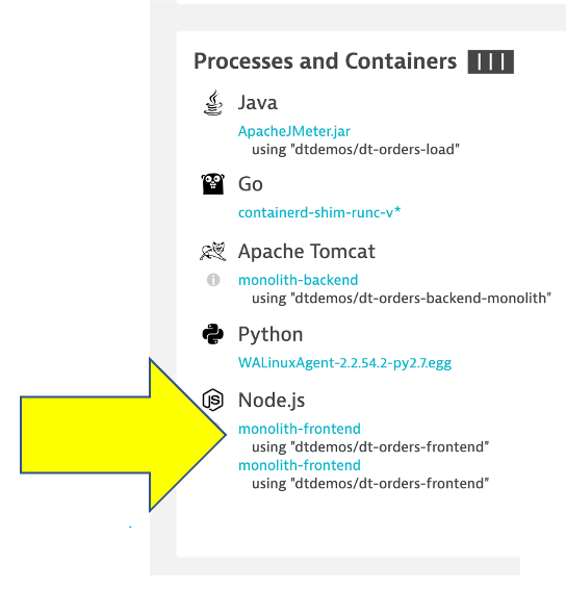
Return back to the host view for the host with the prefix of dt-orders-monolith and locate the Processes and Containers section.
Click on the monolith-frontend process to open the process detail view.
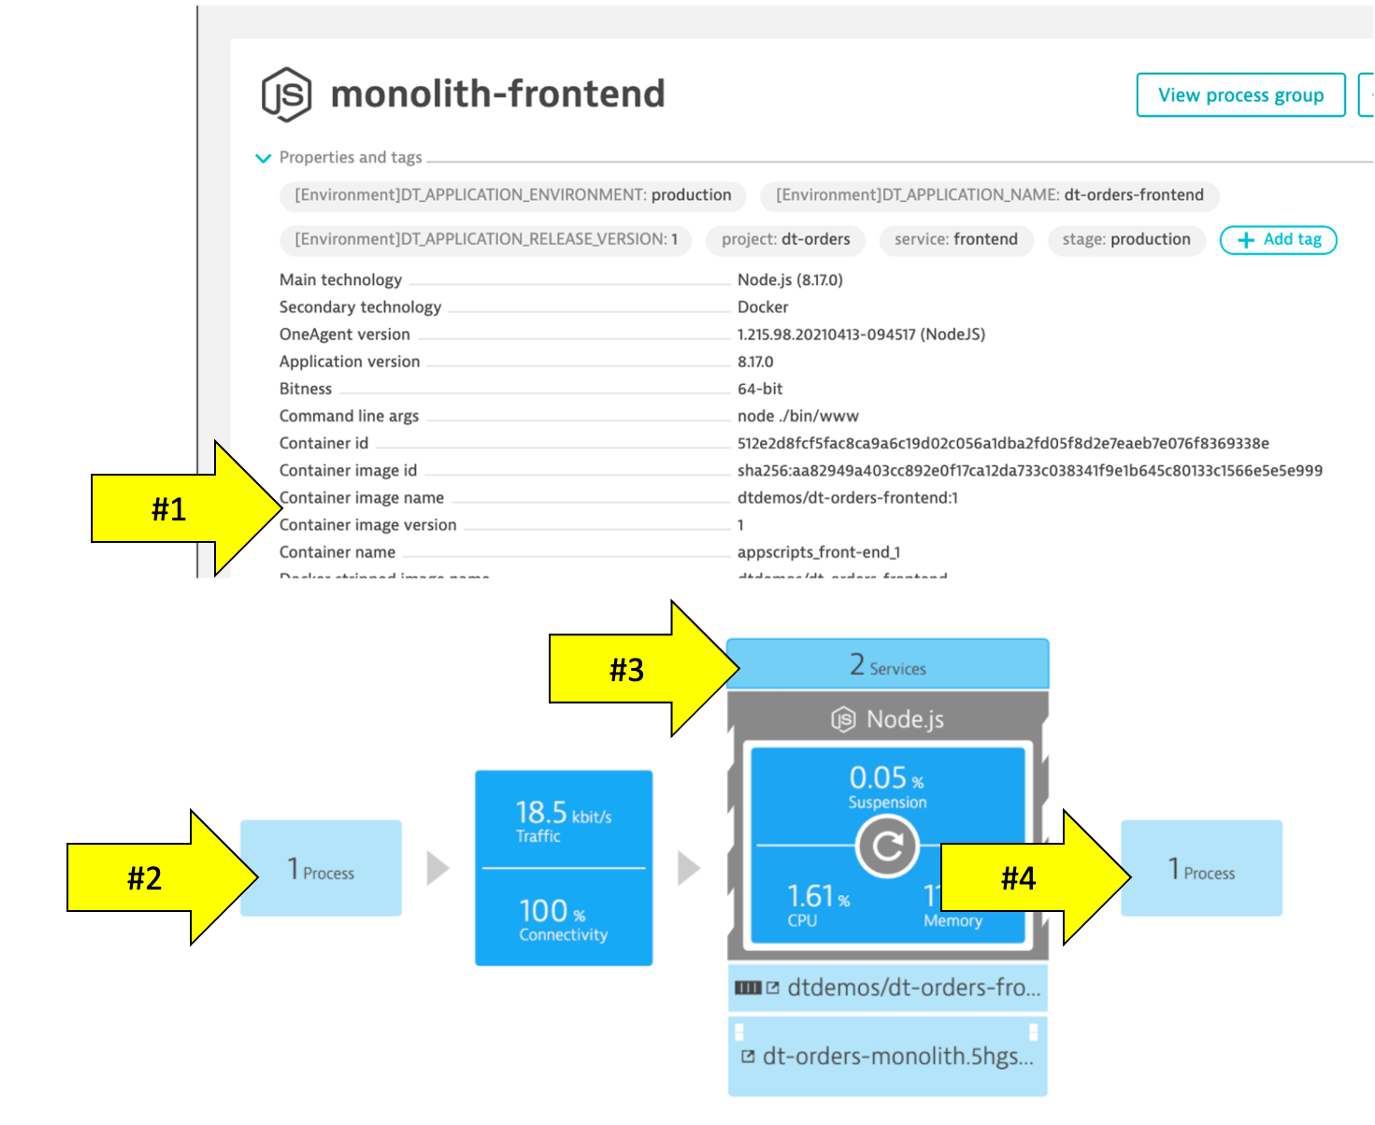
Process view
You should be on the process page where you will see information for this process. Follow the picture below to locate the following:
- Click on the
Propertiesline to toggle on/off to see additional data. Did you notice Docker? - On the info graphic, click to view the processes that call this process (Inbound)
- On the info graphic, click to view the services that are served by this process. In this case there are multiple
- On the info graphic, click to view the processes that this process calls (Outbound)
💥 TECHNICAL NOTE
_Dynatrace automatically recognizes many common processes like Tomcat and will capture process specific metrics such as JVM garbage collection. See a list of supported technologies, languages and containers in the Dynatrace documentation_
Dynatrace and containers
In the picture above, the arrow shows the properties for Docker.
Our sample app was built as a Docker container and Dynatrace hooks into containers and provides code for injecting OneAgent into containerized process.
How Dynatrace monitors containers

Dynatrace hooks into containers and provides code for injecting OneAgent into containerized processes.
There’s no need to modify your Docker images, modify run commands, or create additional containers to enable Docker monitoring. Simply install OneAgent on your hosts that serve containerized applications and services. Dynatrace automatically detects the creation and termination of containers and monitors the applications and services contained within those containers.
💥 TECHNICAL NOTE
_You can read more about Dynatrace Docker Monitoring here and technical details here_
View a Service
Now Let’s review a specific service.
- Click the
servicessquare above the host infographic to open the list of services - From the list of services, choose the
frontend

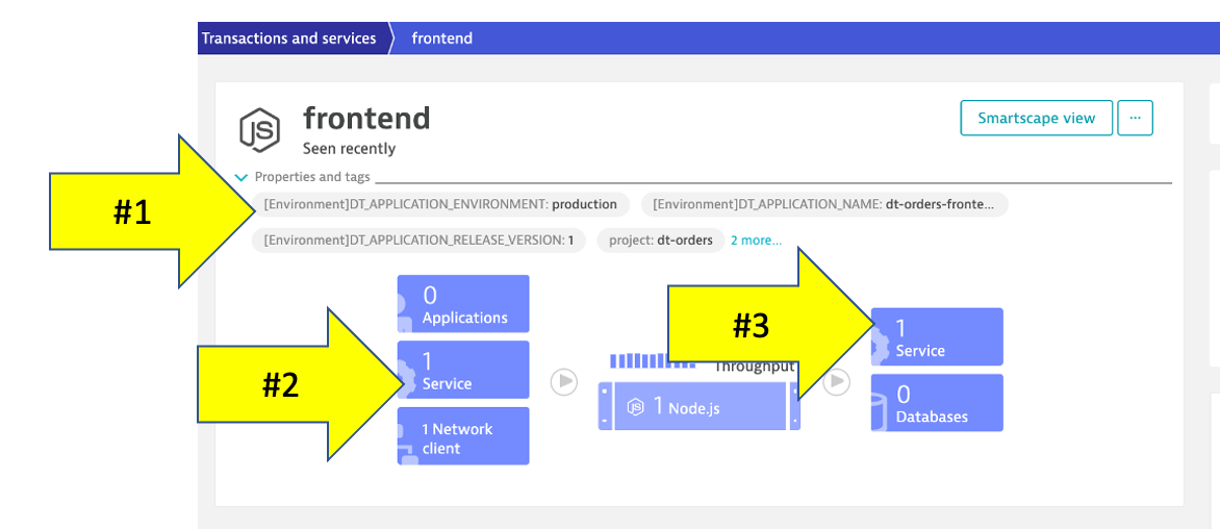
Service View
You should be on the service page where you will see information for this specific service. Follow the picture below to locate the following:
- Click on the
Propertiesline to toggle on/off to see additional data - Click to view the services that call this service (Inbound)
- Click to view the services that this service calls (Outbound)