Metric Streams
Metric Streams
Dynatrace Davis automatically analyzes abnormal situations within your IT infrastructure and attempts to identify any relevant impact and root cause. Davis relies on a wide spectrum of information sources, such as a transactional view of your services and applications, as well as all on events raised on individual nodes within your Smartscape topology.
There are two main sources for single events in Dynatrace:
- Metric-based events (events that are triggered by a series of measurements)
- Events that are independent of any metric (for example, process crashes, deployment changes, and VM motion events)
Custom metric events are configured in the global settings of your environment and are visible to all Dynatrace users in your environment.
1. Setup Custom metric alerting for AWS
1 . To add custom alerts, navigate to Settings --> Anomaly Detection --> Metric events menu.
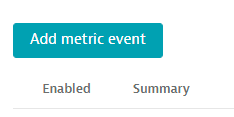
2 . Click the Add metric events button.
3 . Fill in the below information on the Add metric event template
- Summary:
CPU % percentage - Type:
Metric keyfrom dropdown - Metric key
EC2 CPU usage %from dropdown - Agregation
Averagefrom dropdown - Management zone
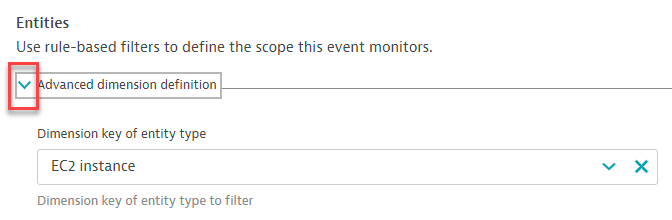
dt-orders-monolith - under entities click on
>to seeDimension key of entity typeand selectEC2 instancefrom dropdown
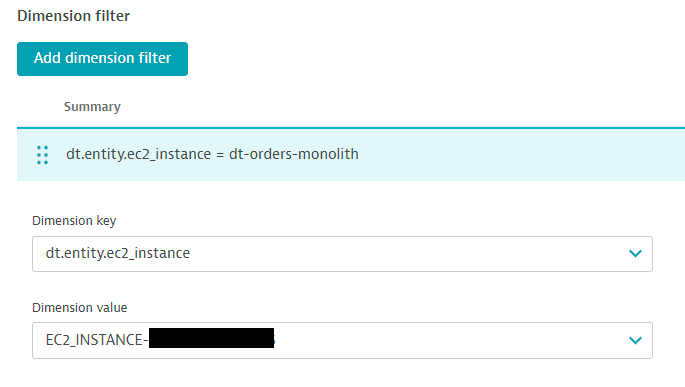
- Dymension filter click on
Add dimension filterand select as shown below.
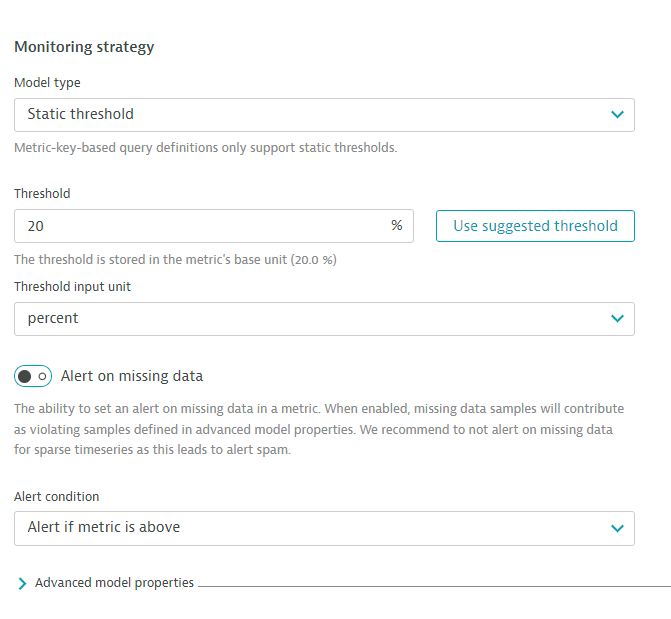
- under Monitoring strategy section select as shown.
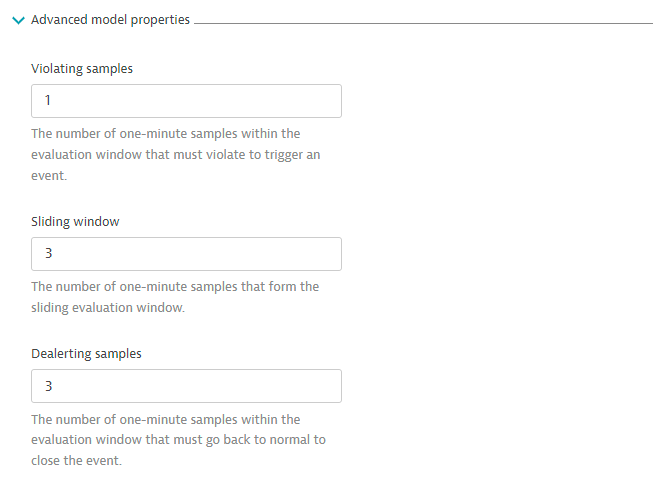
- select the
>next toAdvanced model propertiesand input as shown.
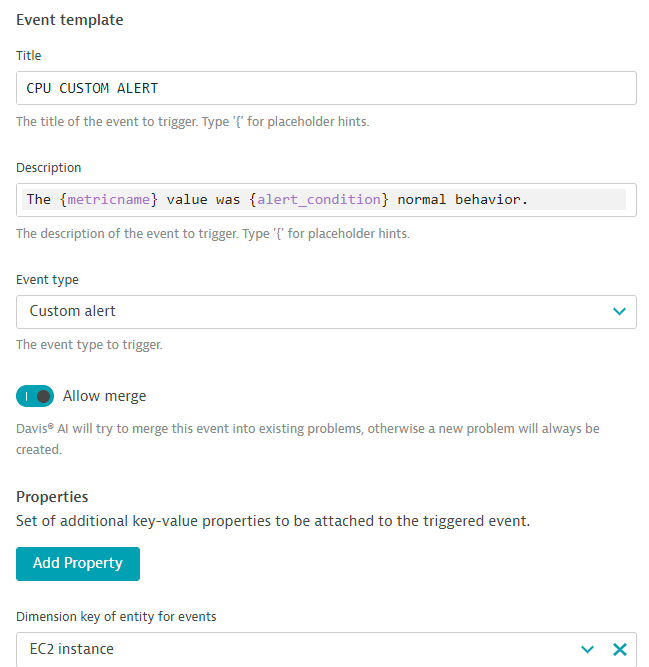
- In the
Event templatesection add:- Title:
CPU CUSTOM ALERT - Event type from dropdown:
Custom alert - Dimension key of entity for events select
EC2 instancefrom dropdown
- Title:
- click on
Save Changes
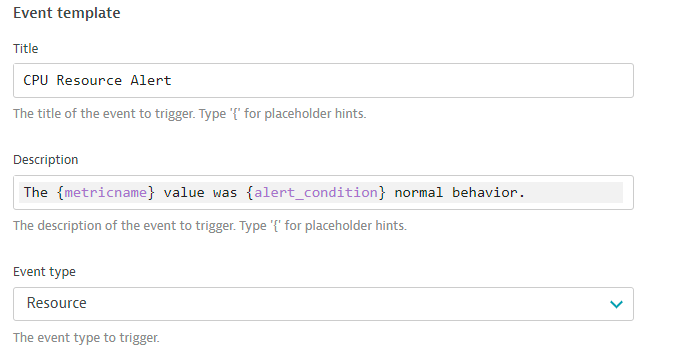
4 . Add another rule, with everything the same, except for the Event Description to have the title as CPU Resource Alert and Event type = RESOURCE as shown below.
- toggle the
Alert on missing datatooff
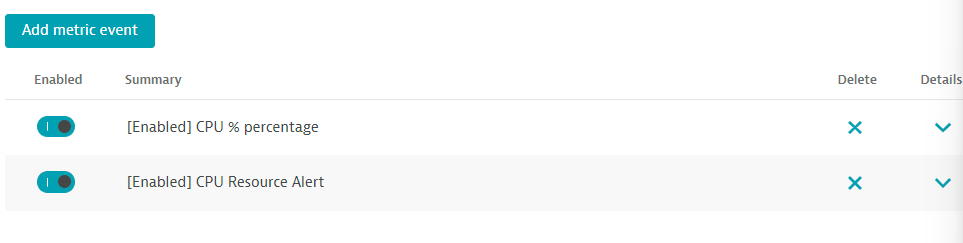
5 . Save your changes and the list should look as shown below.
2. SSH to monolith host
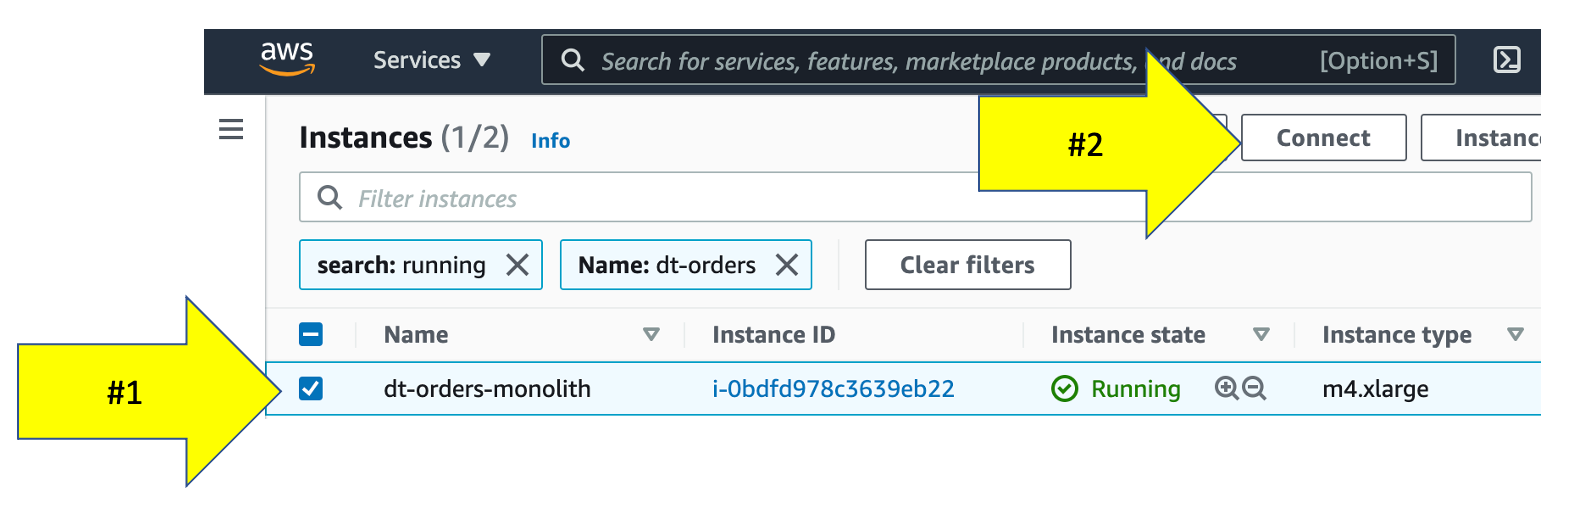
To connect to the host, simply use EC2 Instance Connect. To this, navigate to the EC2 instances page in the AWS console.
From the list, pick the dt-orders-monolith and then the connect button.
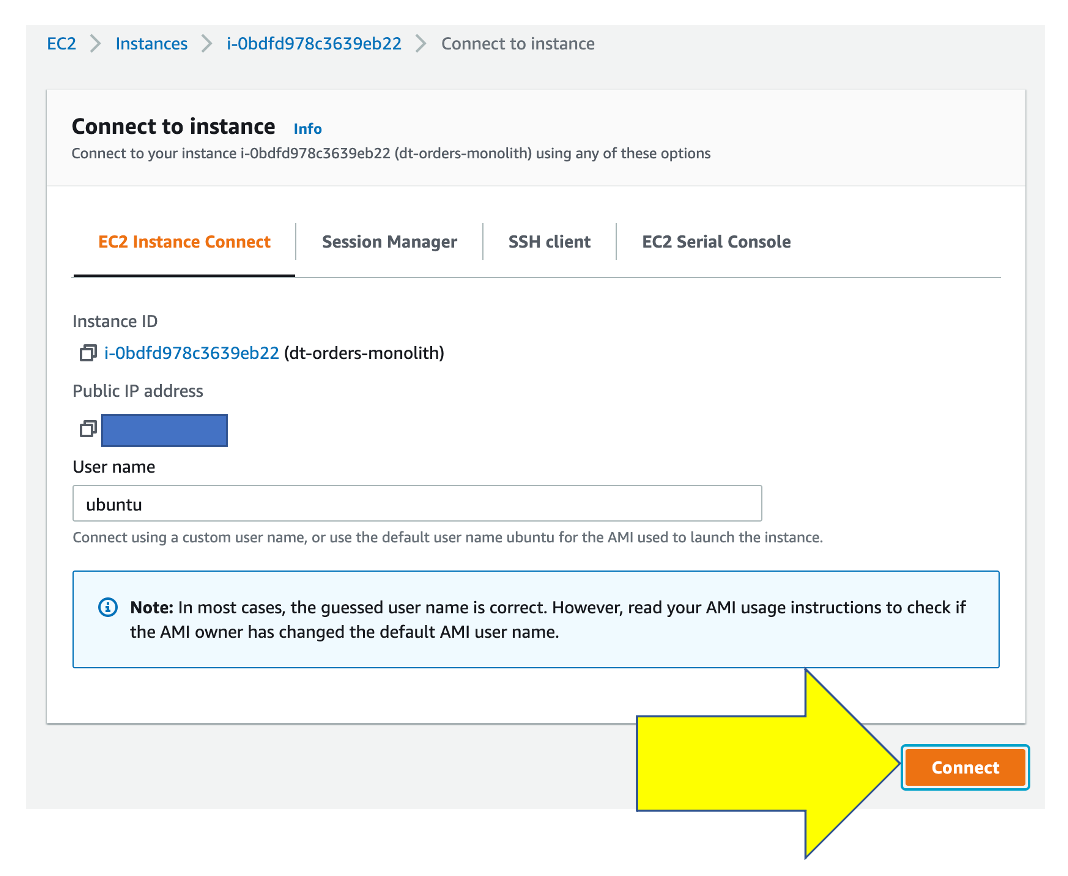
Then on the next page, choose the EC2 Instance Connect option and then the connect button.
Once you connected, you will see the terminal prompt like the below.
Welcome to Ubuntu 20.04.2 LTS (GNU/Linux 5.4.0-1045-aws x86_64)
...
...
To run a command as administrator (user "root"), use "sudo <command>".
See "man sudo_root" for details.
ubuntu@ip-10-0-0-118:~$
3. Trigger a CPU problem
Using a unix utility yes, we can generate CPU stress just by running the yes command a few times.
In the terminal, copy all these lines and run them:
yes > /dev/null &
yes > /dev/null &
yes > /dev/null &
To verify, run this command:
ps -ef | grep yes
The output should look like this:
ubuntu    5802  5438 99 20:48 pts/0    00:00:05 yes
ubuntu    5805  5438 89 20:48 pts/0    00:00:04 yes
ubuntu    5806  5438 97 20:48 pts/0    00:00:03 yes
ubuntu    5818  5438  0 20:48 pts/0    00:00:00 grep --color=auto yes
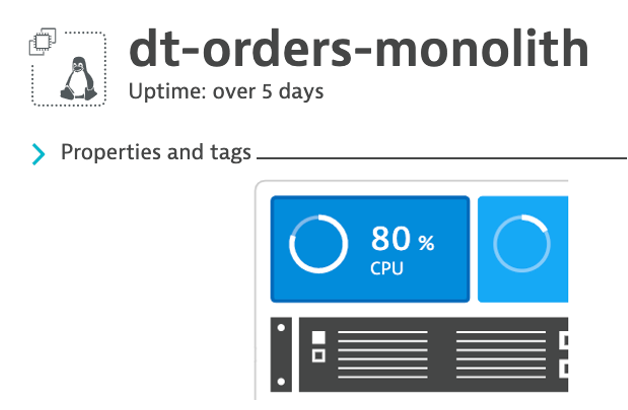
3 . Back in Dynatrace within the host view, the CPU should now be high as shown below
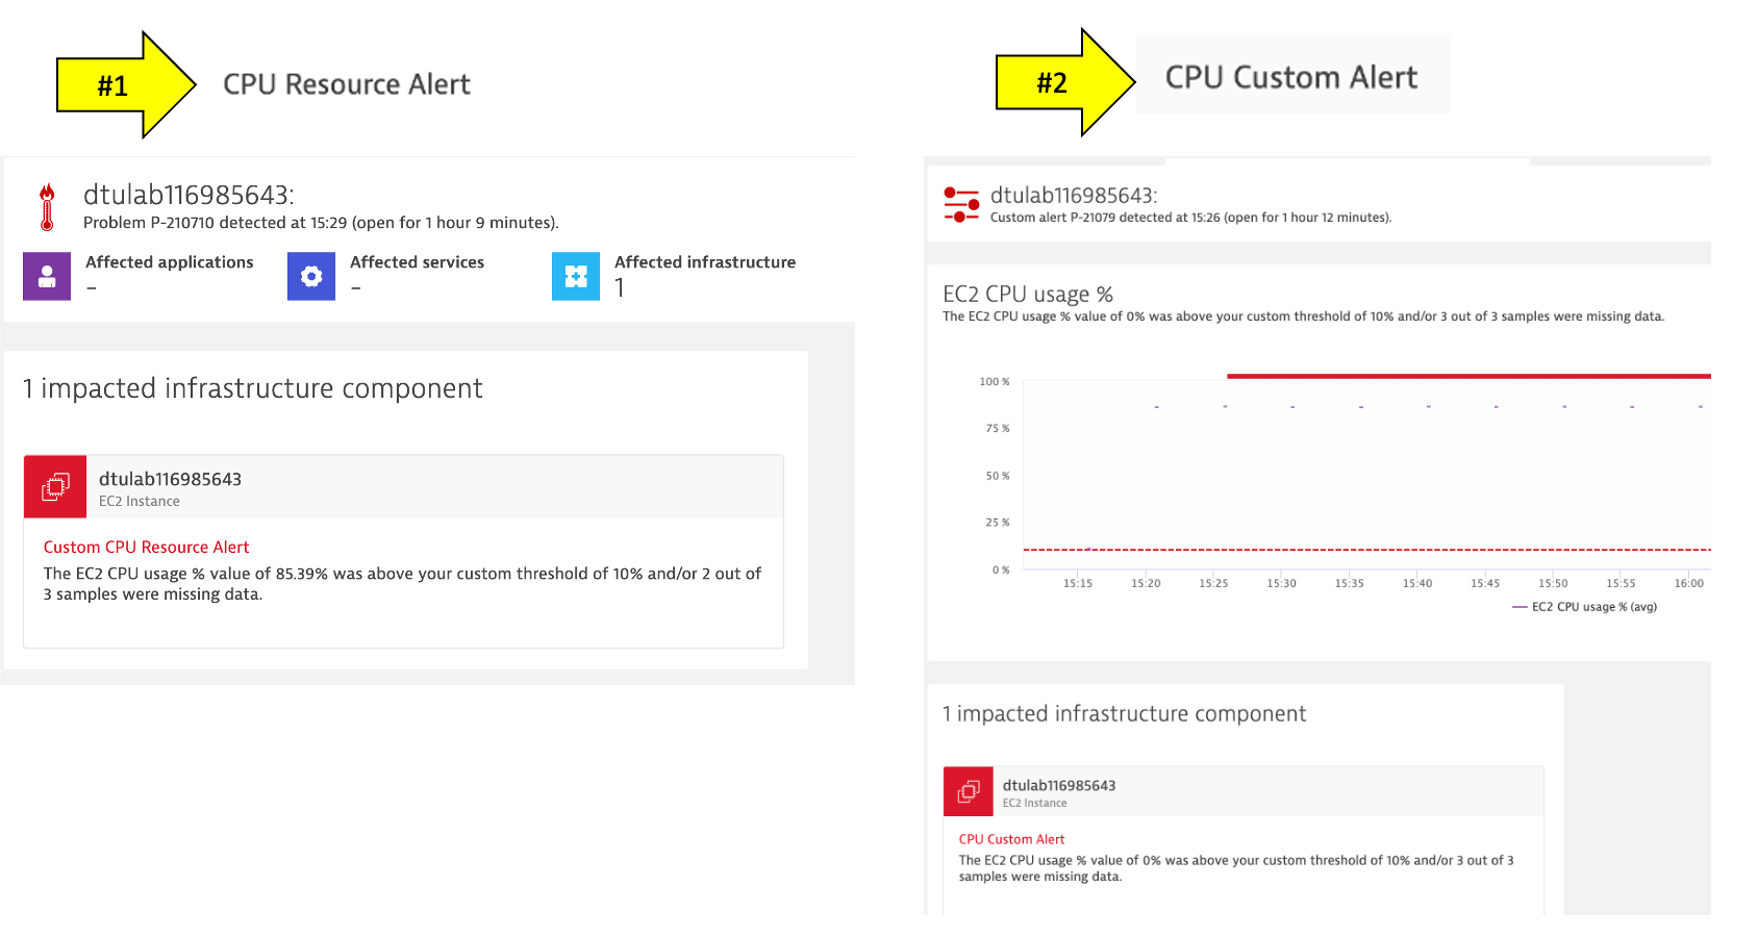
4 . It may take a minute or so, but you will get two problem cards as shown below. #1 is the alert from the severity = RESOURCE where Davis was invoked, and #2 is the alert from severity = CUSTOM ALERT.
4. Review Problem Notifications
1 . Navigate to Settings --> Integrations --> Problem Notifications
2 . Read the overview and then click the Add Notification button
3 . Click various Notification types from the drop down to review the configurations inputs.
4 . For the Custom integration type, review the option to customize the payload.
5 . Notice how you can choose the Alert profile, but you only have default
5. Review Alerting Profiles
1 . Navigate to Settings --> Alerting --> Alerting profiles
2 . Read the overview and then expand the default rule.
3 . Now add one, by clicking on the Add alerting profile button
4 . Review the options to choose severity rules and filters
6. Stop the CPU problem
To stop the problem, you need to kill the processes. To do this:
1 . Back in the CloudShell, run this command to get the process IDs ps -ef | grep yes
2 . For each process, copy the process ID and run kill <PID>
For example:
#### If output is this...

ubuntu@ip-10-0-0-118:~$ ps -ef | grep yes
ubuntu    5802  5438 99 20:48 pts/0    00:00:05 yes
ubuntu    5805  5438 89 20:48 pts/0    00:00:04 yes
ubuntu    5806  5438 97 20:48 pts/0    00:00:03 yes

#### Then run...

kill 5802
kill 5805
kill 5806
3 . Verify they are gone by running this again ps -ef | grep yes
4 . Verify that CPU in Dynatrace goes to normal and the problems will eventually automatically close
6. Exit the SSH
Simply type exit to exit the VM and return the CloudShell.
💥 TECHNICAL NOTE
- Alert configuration is available through the Anomaly detection—metric events API. Using the API, you can list, update, create, and delete configurations.