Lab Setup
Lab Setup
For this lab you are going to setup an EC2 instance that runs a Sample application that you can use to learn the Dynatrace web UI and to review how Dynatrace brings tremendous insights all through the OneAgent.
Referring to the picture below, here are the components for lab 1.
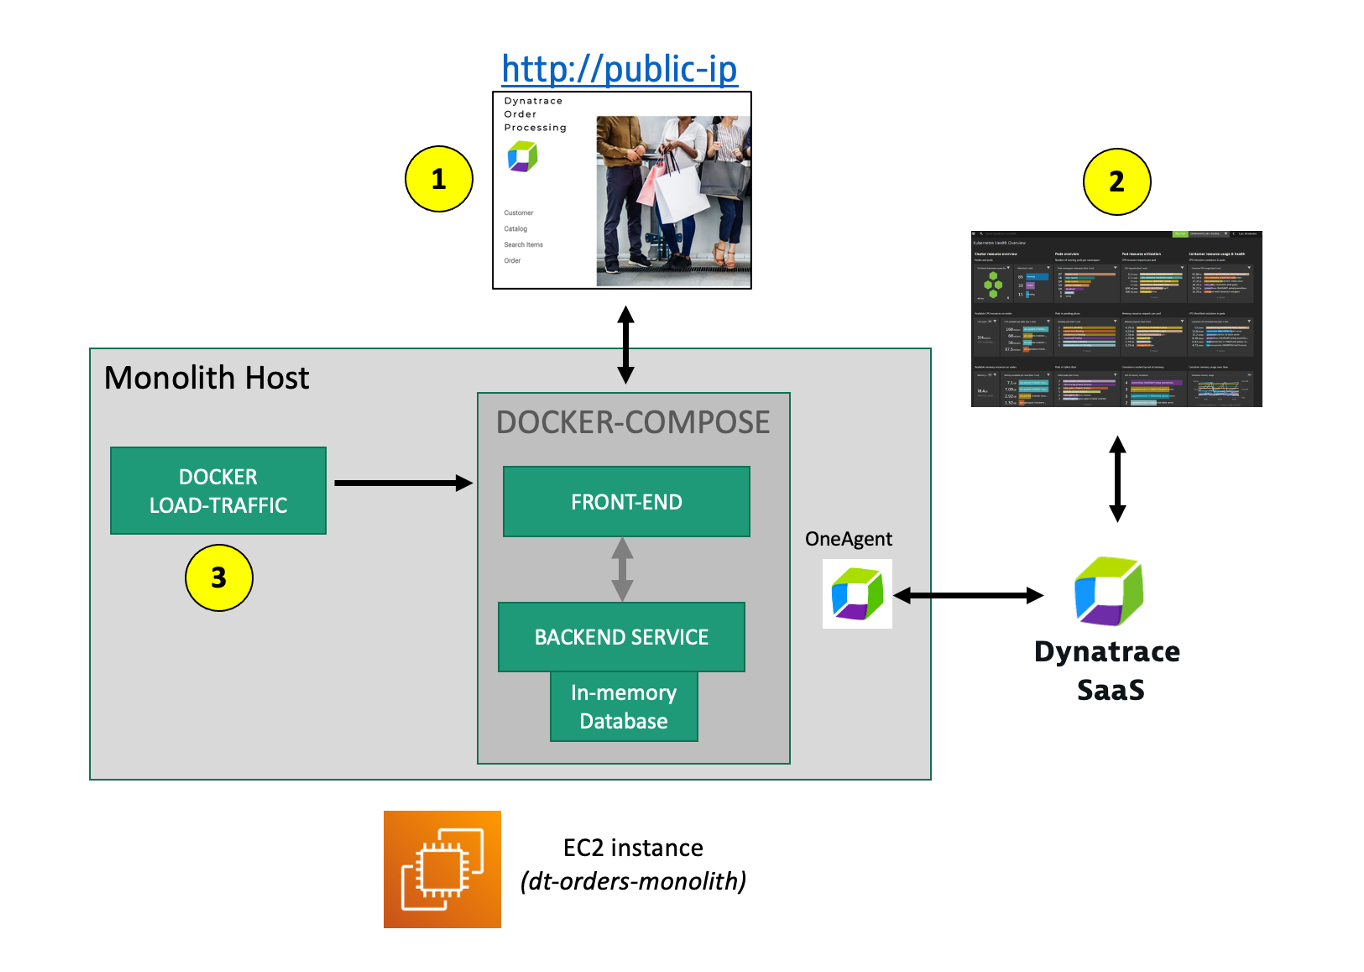
#1 . Sample Application
Sample app representing a simple architecture of a frontend and backend implemented as Docker containers that we will review in this lab.
#2 . Dynatrace monitoring
The Dynatrace OneAgent has been installed by the workshop provisioning scripts and is communicating to your Dynatrace Tenant.
💥 TECHNICAL NOTE
Learn more about the various ways the OneAgent can be installed, in the Dynatrace documentation
#3 . Load generator process
A JMeter process sends simulated user traffic to the sample app running within a Docker container. You will not need to interact with this container, it just runs in the background.
💥 TECHNICAL NOTE:
A real-world scenario would often start with the application components running on a physical or virtualized host on-prem and not “Dockerized”. To simplify the workshop, we “Dockerized” the application into a front-end and back-end. In Dynatrace, these Docker containers all show up as “processes” on a host just like a “non-Dockerized” application will.
Sample app
The sample application is called Dynatrace Orders. A more detailed overview can be found here. All the source code can be found here.
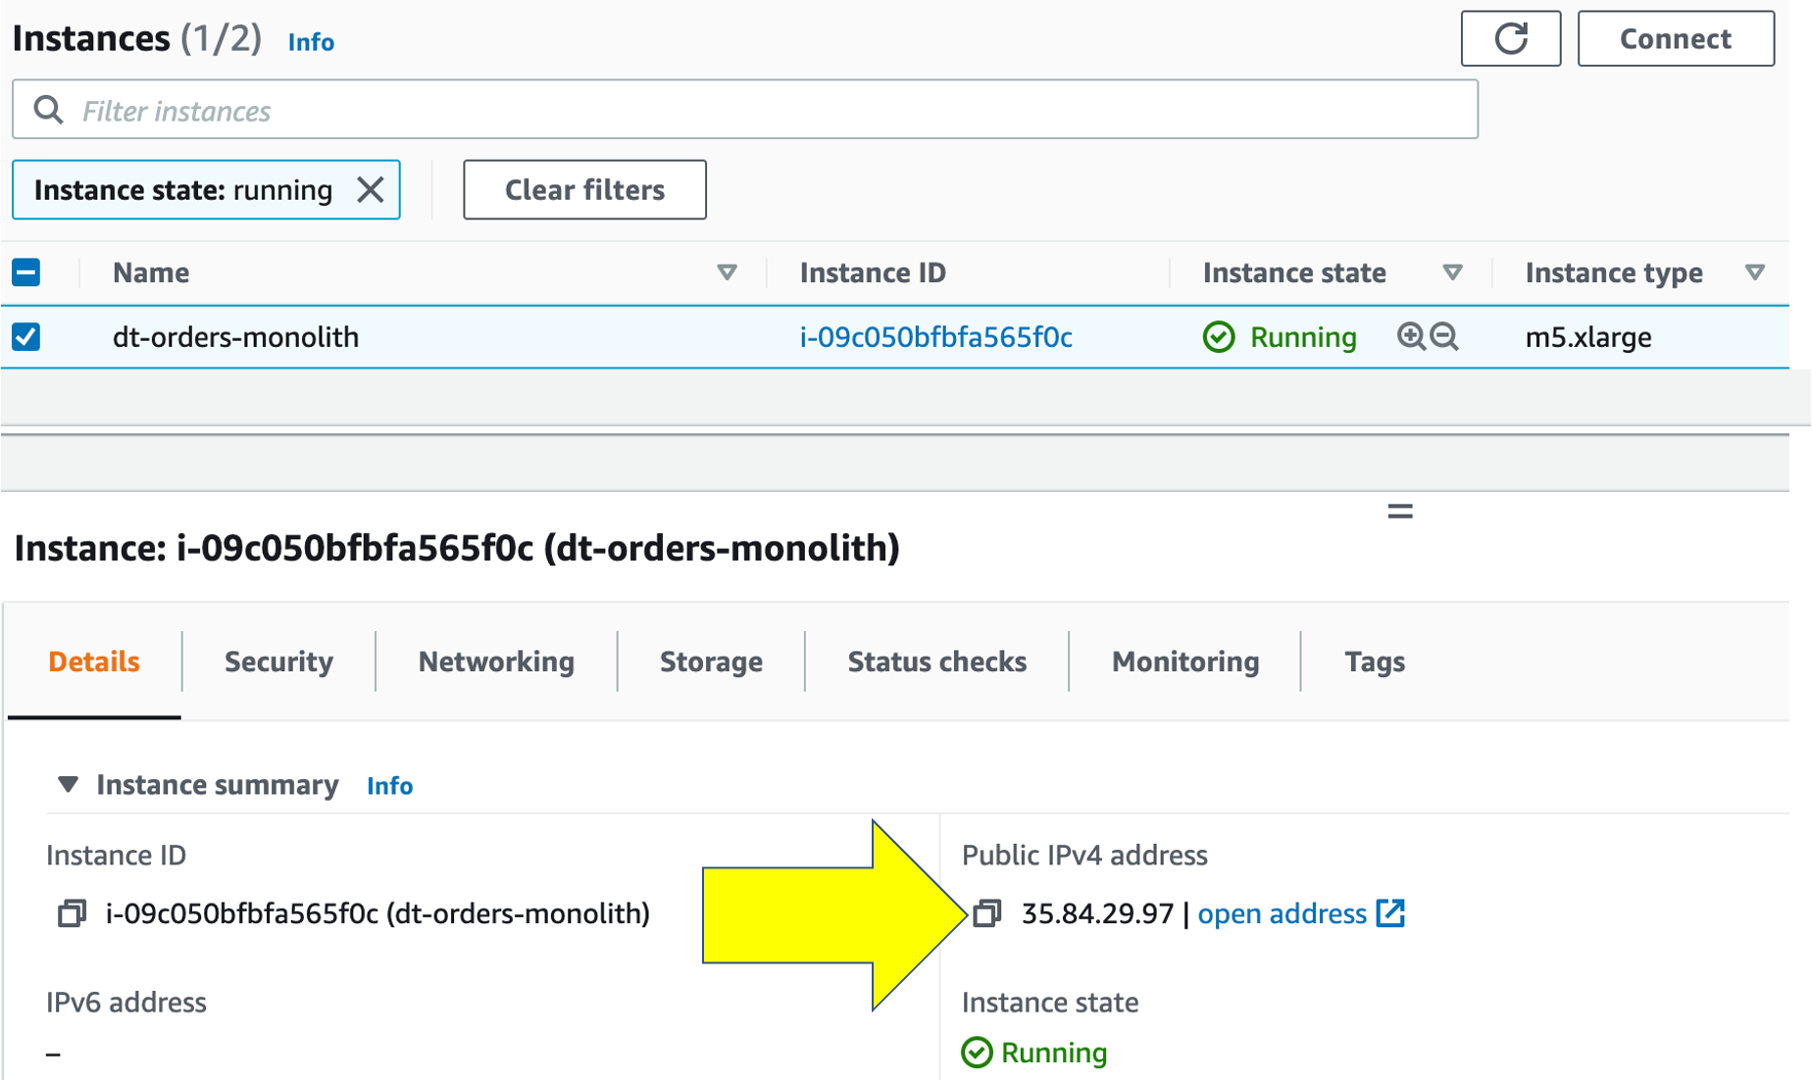
Get the Public IP to the frontend of the Sample Application.
To get the Public IP, open the EC2 instances page in the AWS console. On the newly created host dt-orders-monolith find the Public IP as shown below.
View the Sample app in a Browser
To view the application, paste the public IP using HTTP NOT HTTPS into a browser that will look like this:
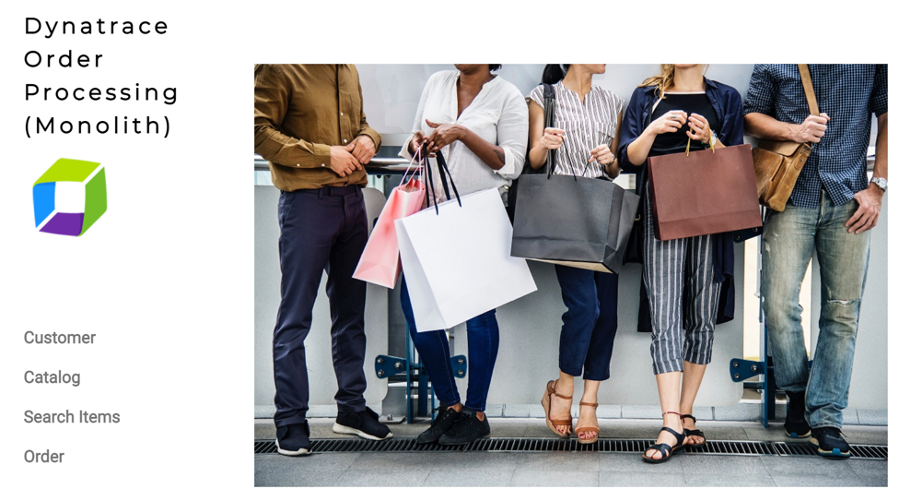
Use the menu on the home page to navigate around the application and notice the URL for key functionality. You will see these URLs later as we analyze the application.
- Customer List =
customer/list.html - Customer Detail - Each customer has a unique page =
customer/5.html - Catalog List =
catalog/list.html - Catalog Search Form =
catalog/searchForm.html - Order List =
order/list.html - Order Form =
order/form.html