Review Service Flow
Review Service Flow
-
Return to the
frontendservice. You can use thebreadcrumbmenu as shown below.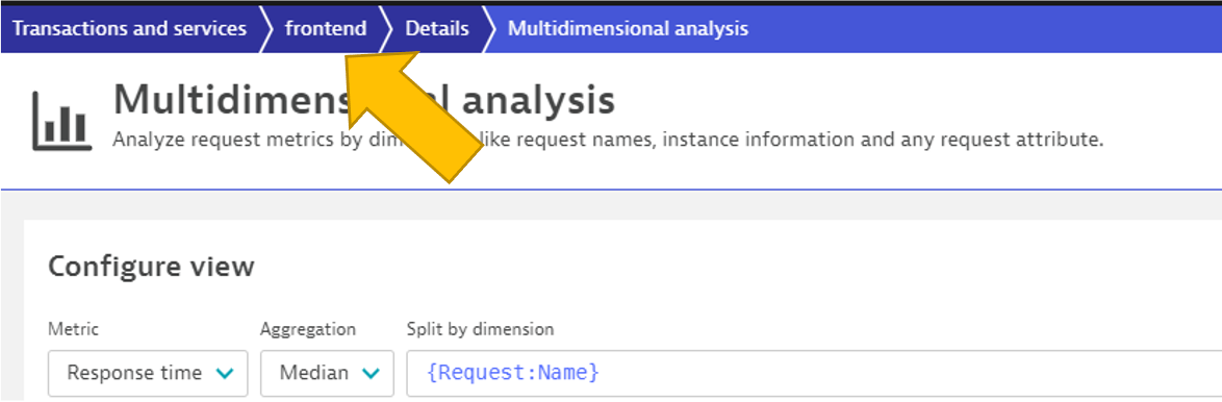
-
On the
frontendservice page, locate the Understand dependenciessection on the right, and then click theview Service flow` button.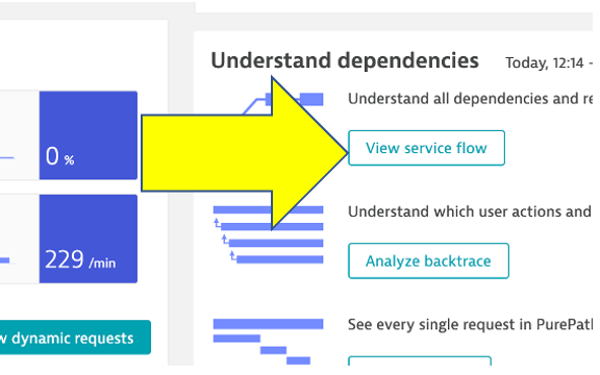
Response time perspective
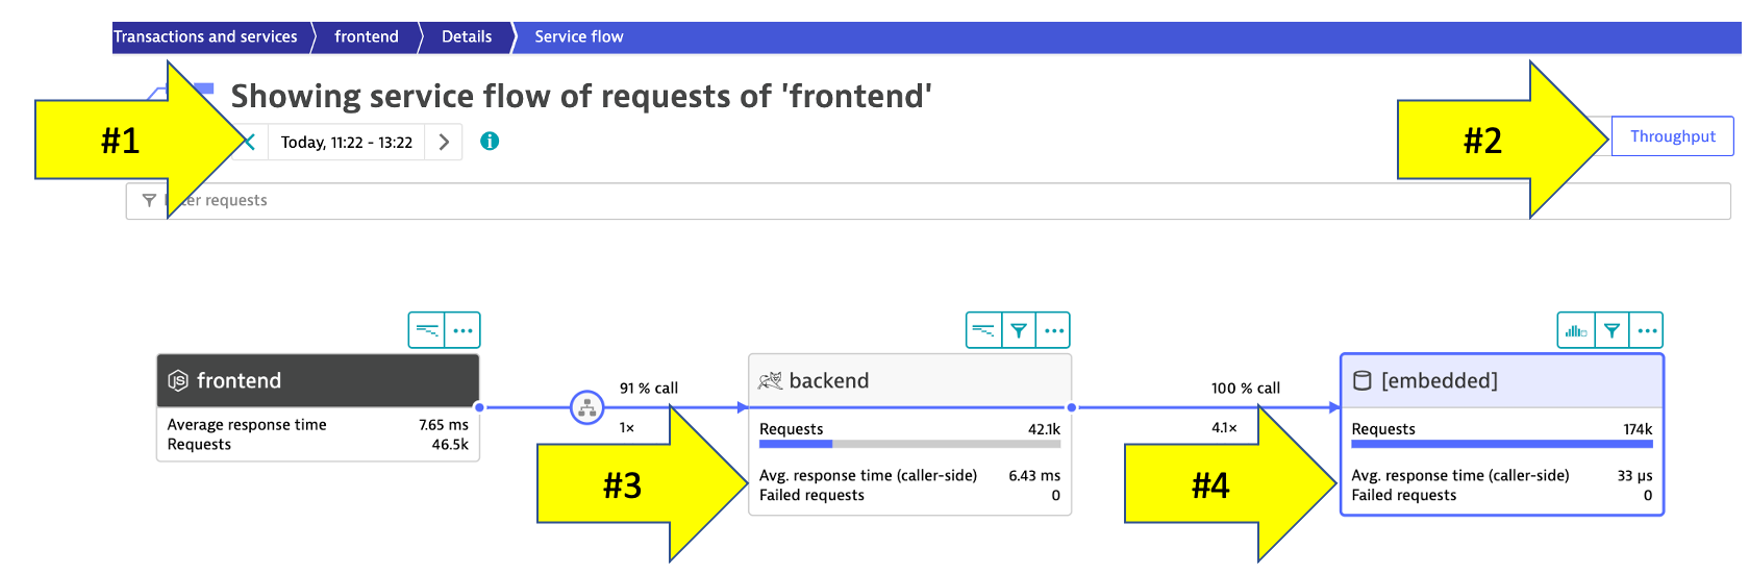
You should now be on the Service flow page.
Right away, we can see how this application is structured:
- Frontend calls backend
- Backend calls database
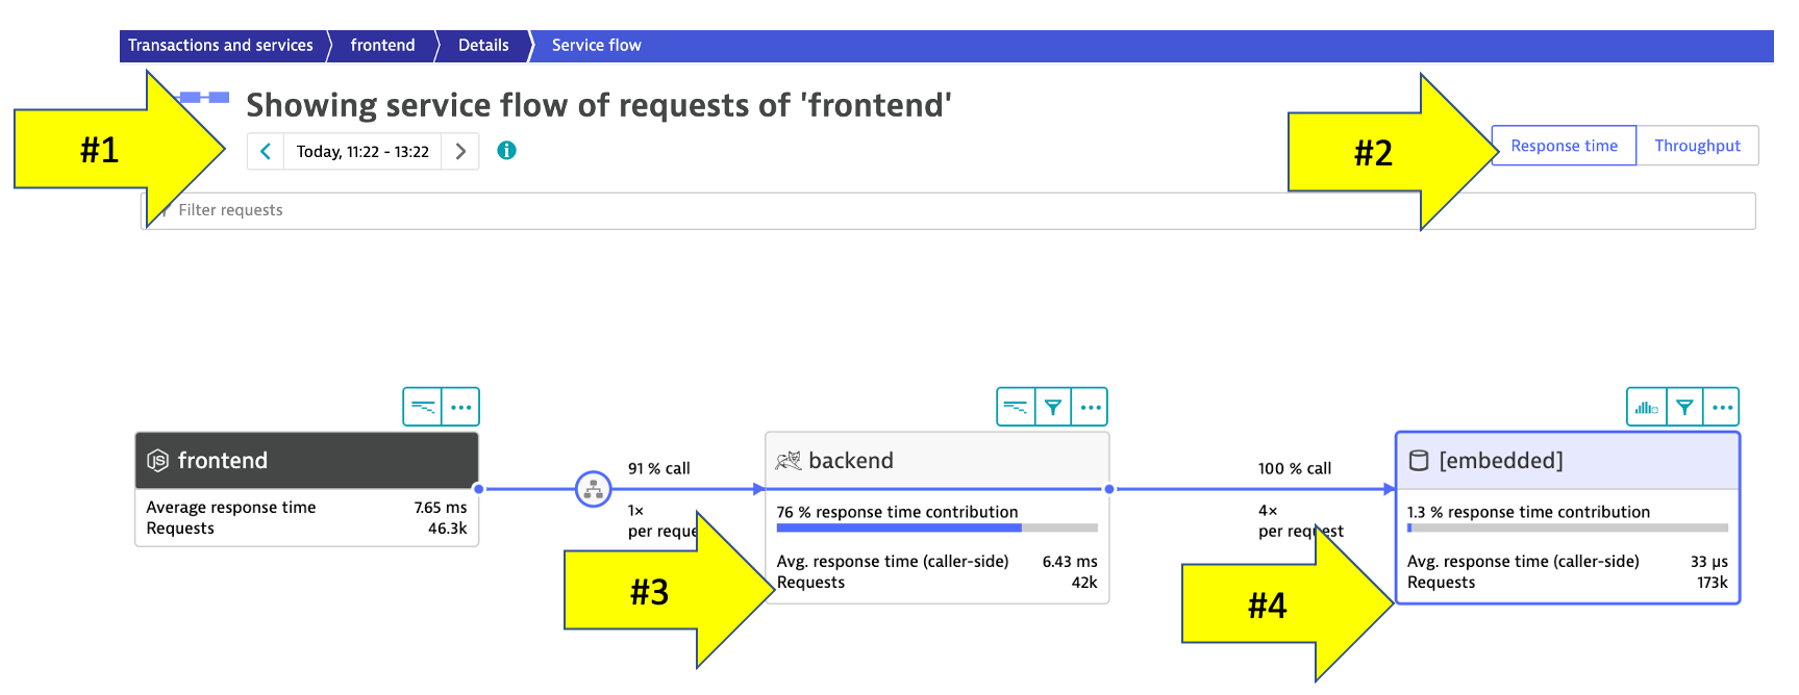
Refer to the numbers in the picture above:
- The timeframe defaults to whatever you have your global timeframe selector set to, up to a maximum of 24 hours.
- We are viewing the data from a Response time perspective. Shortly, we will review the Throughput perspective.
- Click on the boxes to expand the response time metrics. We can see that most of the response time, most of the time is spent in the backend service.
- Even though there are a few calls to the database for every backend service request, only a very small amount of the response time is spent in the database.
Throughput perspective
Refer to the numbers in the picture above:
- The timeframe defaults to 10 minutes but can be adjusted
- Change to the Throughput perspective by clicking on the box
- Click on the boxes to expand the metrics to see the number of requests and average response times going to the backend sevice
- We can see the number of requests to
backenddatabase
Analyze service backtrace
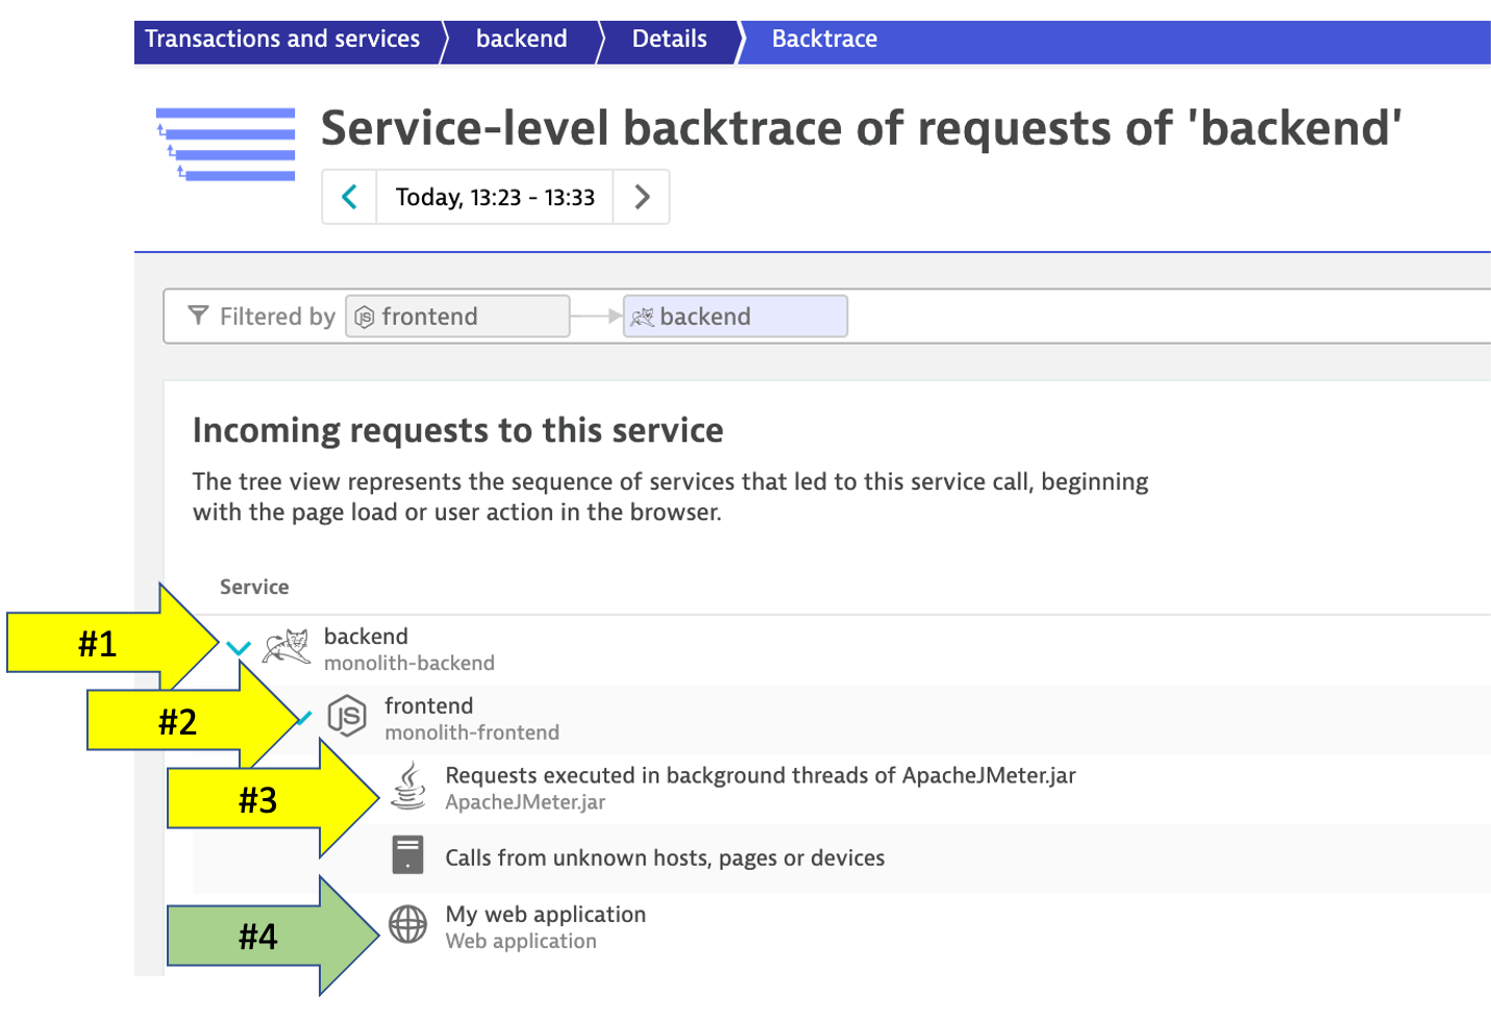
Dynatrace understands your applications transactions from end to end. This transactional insight is visualized several ways like the backtrace.
The backtrace tree view represents the sequence of services that led to this service call, beginning with the page load or user action in the browser.
👍 How this helps
Using the service flow and service backtrace, these two tools give you a complete picture of interdependency to the rest of the environment architecture at host, processes, services, and application perspectives.
Review Service backtrace
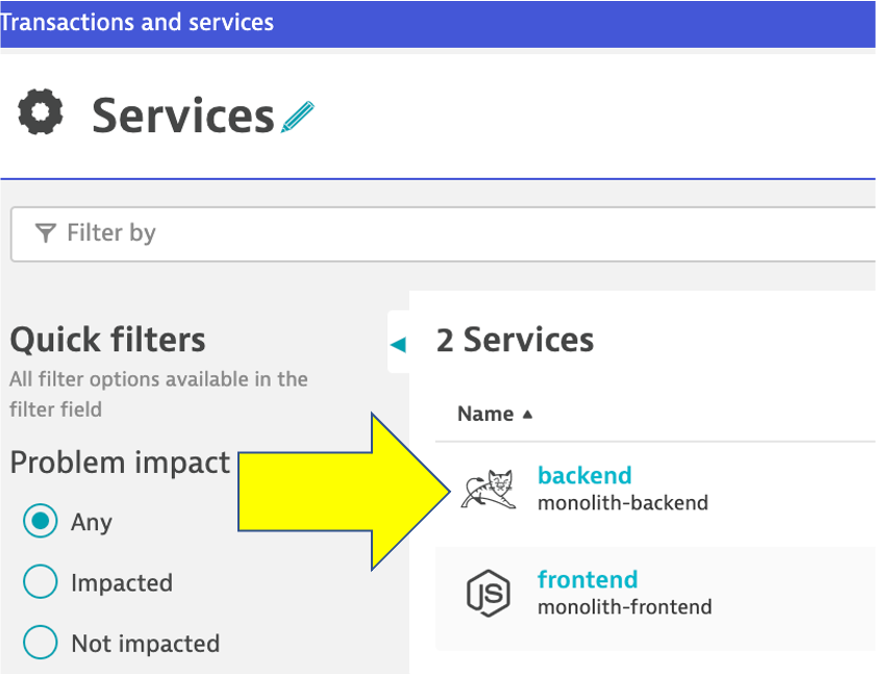
Let’s now take a look at the Services by clicking on the Services left side Dynatrace menu.
Pick the backend service.
On the backend service, click on the Analyze Backtrace button.
![]()
You should be on the service backtrace page where you will see information for this specific service.
This will get more interesting in the next lab, but for the monolith backend, we can see that the backtrace is as follows:
- The starting point is the
backend backendis called by thefrontendserviceApacheJMetertraffic from the load generator script- You may also see browser traffic to the frontend from the
My web application. If you don’t that is OK.
If you click on any of the rows in the backtrace, the bottom portion of the page will expand.